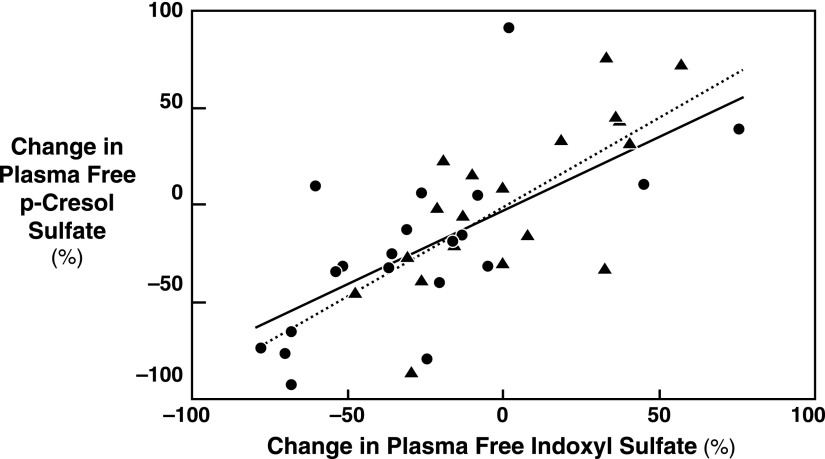
Figure 2.
The relation of indoxyl sulfate and p-cresol sulfate plasma free level changes in individual patients. The change in plasma free levels for indoxyl sulfate and p-cresol sulfate in individual patients was closely related for both the fiber and control groups. The patients receiving fiber are represented by circles (●) and the solid line (r=0.81, P<0.001) and the patients receiving control starch are represented by triangles (▲) and the dashed line (r=0.94, P<0.001). The changes in levels were also correlated in the study population as a whole (r=0.76, P<0.001, not shown).

