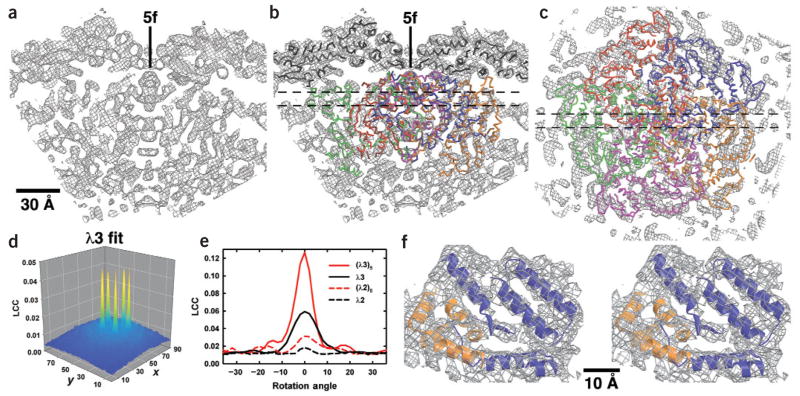
Figure 3.
Fits of λ1 and λ3 X-ray models into reovirion cryo-EM map. (a) Slab through the cryo-EM map (10 Å thick), encompassing a five-fold axis and including core densities from low radii (~172 Å at bottom of panel) to the outer surface of the λ1 shell (radius ≈ 277 Å at top). (b) Same as a but with X-ray models of λ1 (black Cα backbone) and λ3 (dark orange, blue, orange, magenta and green Cα backbones) fit into the cryo-EM map. (c) Slab through the cryo-EM map (10 Å thick), viewed along a five-fold axis and toward the virion center, with the X-ray model of the λ3 pentamer fitted into the map. Thin dashed lines in b and c mark the boundaries of the slabbed regions shown, respectively, in c and a,b. Scale bar for a–c is labeled. (d) Plot of Laplacian correlation coefficients (LCC) computed by SITUS42, which quantify the fit of the λ3 monomer X-ray model into a defined search volume within the reovirion cryo-EM density map. For this calculation, the cryo-EM map was rotated to make a five-fold axis coincide with the z-axis of a Cartesian coordinate system, and a region encompassing more than one asymmetric unit was selected as the search volume, as described in Methods and Supplementary Methods online. The fit of the λ3 X-ray model into this volume was based on an exhaustive six-dimensional search with angular and translational sampling intervals of 5° and 2.2 Å, respectively. Here the LCCs are only plotted for the z-plane, yielding the best fit, and the value at each x and y position in the plane corresponds to the orientation of the model at that position that gives the highest LCC. The x- and y-axes of the plot identify the pixel coordinates within the search volume, with each pixel representing a step size of 2.2 Å. The value of the maximum peak (0.047) rose only to 0.052 upon Powell minimization refinement42. (e) Plot of the LCC for monomer and pentamer X-ray models of λ3 and λ2 fitted into the reovirion cryo-EM density search volume and for different rotation angles about the icosahedral five-fold axis. The 0° rotation angle for each model corresponds to the orientation and position of that model that gives the best fit as obtained in the experiments illustrated in d. (f) Stereo view of a small portion of the λ3 X-ray pentamer model (blue and orange ribbons distinguish adjacent monomers) fitted into the corresponding density (wire cage) in the 7.6-Å EM map. This region of the map includes minimal overlap between neighboring λ3 models.

