
Figure 6. The Structure of the Stem and Anchor Regions.
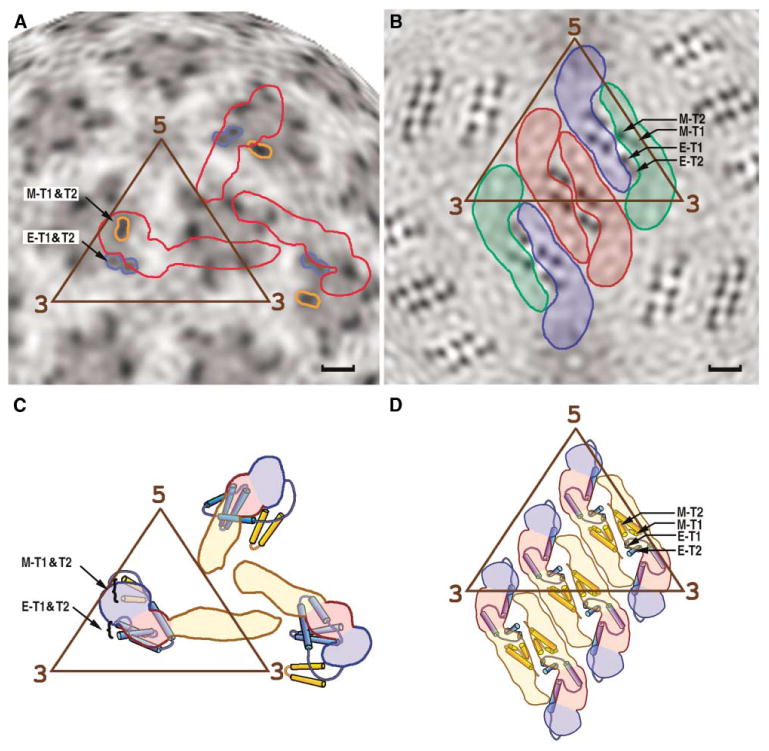
Position of the stem and anchor regions of the E and M proteins in the immature (A and C) and mature (B and D) particles. Radial projections of the three-dimensional cryo-EM densities at radius of 180 Å is shown for the (A) immature and (B) mature dengue virus particles, corresponding roughly to the middle of the lipid bilayer. The outlines of three E monomers, representing one asymmetric unit, are shown in red in (A). The three E monomers per asymmetric unit, arranged as a raft of dimers, are colored red, blue, and green in (B). Darker shading represents higher density regions resulting from the transmembrane protein helices E-T1 and E-T2 of the E glycoprotein and M-T1 and M-T2 for the membrane protein. Structural interpretations are shown in (C) and (D), respectively, where the color code for domains I, II, and III of the E protein is the same as in Figure 1. The scale bar is 20 Å long.