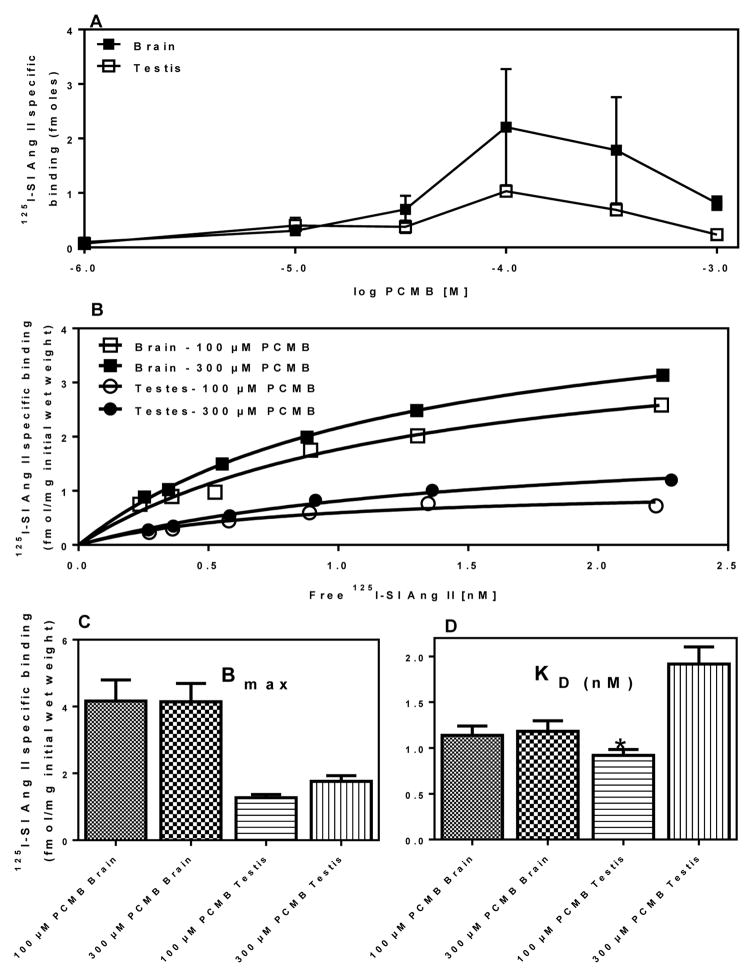
Figure 1. Saturation isotherm for 125 I-SI Ang II binding to brain and testis with 100 μM and 300 μM PCMB.
Panel A: Optimization of PCMB concentration in testis (n=3) and brain (n=2). Panel B: representative plot of specific (3 μM Ang II displaceable) 125I-SI Ang II binding to brain and testis in the presence of 100 or 300 μM PCMB. Panel C: Bmax values for 125 I-SI Ang II binding to Brain and Testis with 100 μM and 300 μM PCMB n = 3. Panel D: KD values for 125 I-SI Ang II binding to Brain and Testis with 100 μM and 300 μM PCMB, n = 3. *Significantly higher affinity than 300 μM PCMB (p = 0.0164).

