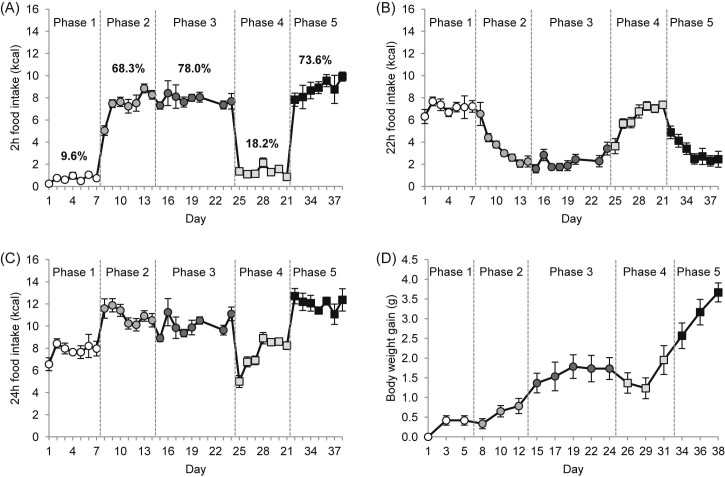
Fig. 1.
Caloric intake (kcal) and body weight (g) of C57BL/6 mice during all study phases, i.e. mice have either 2-h scheduled access to a high fat diet (HFD) and standard diet in the remaining time (adaptation, habituation, refeeding) or 24-h access to standard diet (baseline, replacement). (A) Caloric intake from either HFD or standard diet during the 2 h scheduled feeding time. (B) Caloric intake from standard diet during the remaining 22 h. (C) Total daily caloric intake. (D) Body weight gain. Percentages above data line in A refer to calories consumed from HFD or control diet during schedule feeding time relative to total 24 h intake. Open circles, phase1, baseline; light grey circles, phase 2, adaptation; dark grey circles, phase 3, habituation; grey squares, phase 4, replacement; black squares, phase 5, refeeding. Data are presented as mean ± SEM.

