
Fig. 4.
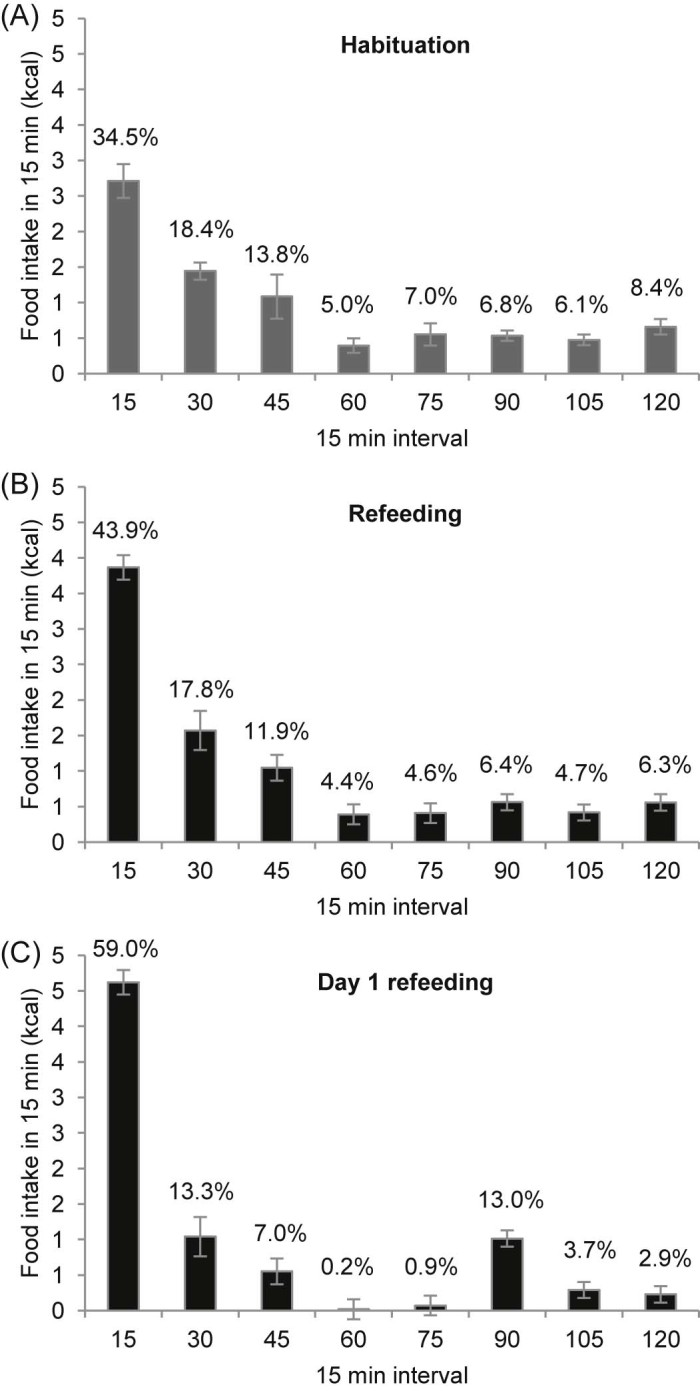
Microstructure of caloric intake from HFD during the 2 h scheduled access during (A) habituation phase, (B) refeeding phase and (C) day 1 of the refeeding phase. Data are shown as absolute values in 15-min bins. Percentages above bars refer to calories consumed in the 15 min bins relative to 2 h intake during scheduled feeding time. Data are presented as mean ± SEM.