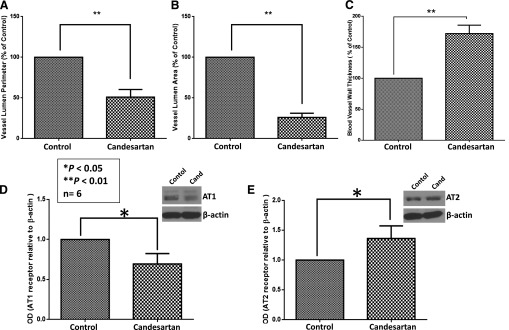
Fig. 6.

Candesartan treatment helps with vascular normalization in tumor xenografts in vivo. (A) Bar graph showing reduced lumen perimeter in tumor xenografts treated with clinically relevant doses of candesartan as compared with saline-treated controls. (B) Bar graph showing reduced vessel lumen area in tumor xenografts treated with clinically relevant doses of candesartan as compared with saline-treated controls. (C) Bar graph showing increased vessel wall thickness in tumor xenografts treated with clinically relevant doses of candesartan as compared with saline-treated controls. (D) Representative Western blot (insert) and bar graph showing significant inhibition of AT1 receptor expression in PC3 tumor xenografts with candesartan treatment. (E) Representative Western blot (insert) and bar graph showing significant increase in AT2 receptor expression in PC3 tumor xenografts with candesartan treatment. Data are presented as the mean ± S.D. Cand, candesartan; OD, optical density.
