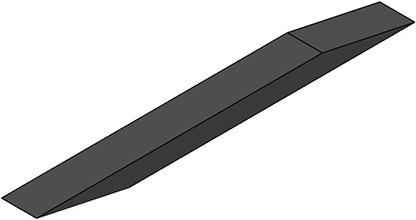
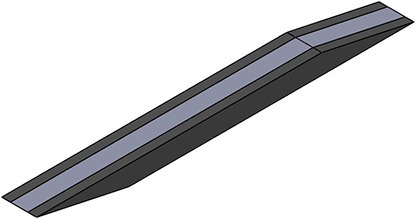
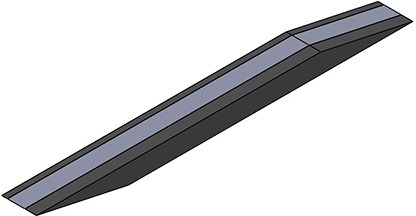
Table 1.
Level and regionalization of activation in different simulations.
| Activation pattern | Uniform | Proximal-distal | Midline | Medial-lateral |
|---|---|---|---|---|
| First view |  |
 |
 |
 |
| (Second view) |  |
 |
 |
 |
| αmax | 0.1 | 0.2 | 0.2 | 0.2 |
For heterogeneous patterns, the light gray region was activated to the prescribed maximum level (last row), while the dark gray region(s) are inactive. Note that for the medial-lateral activity pattern, the region of activity was not symmetric about the mid-plane (x = 27.5 mm) but instead was offset to one side, to be symmetrical about the plane x = 32.1 mm.
