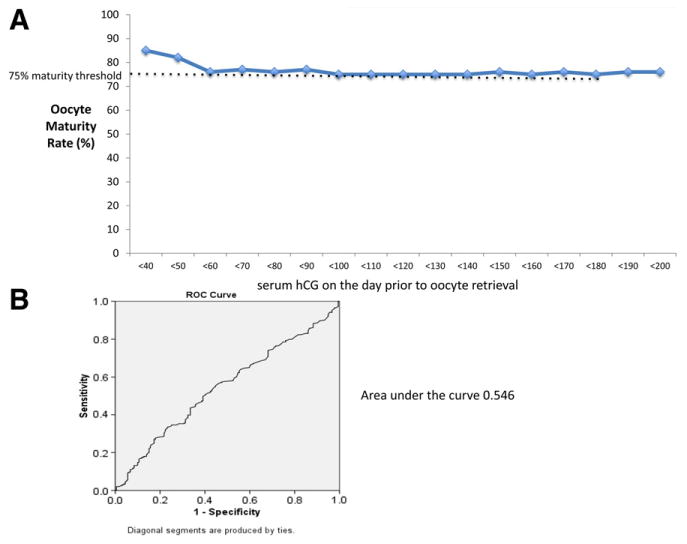
Figure 2.

(A) Less than efficiency curve of oocyte maturity based on serum hCG thresholds. The curves calculated the oocyte maturity below each hCG threshold beginning at <40 mIU/mL and continuing in increments of 10 mIU/mL. Thresholds values were set such that any value <75% (black dashed line) would be considered abnormal maturity rate. (B) Receiver operator characteristic (ROC) curve for the ability of serum hCG level to predict oocyte maturity. Area under the curve = 0.546.
Levy. Preretrieval serum hCG. Fertil Steril 2013.
