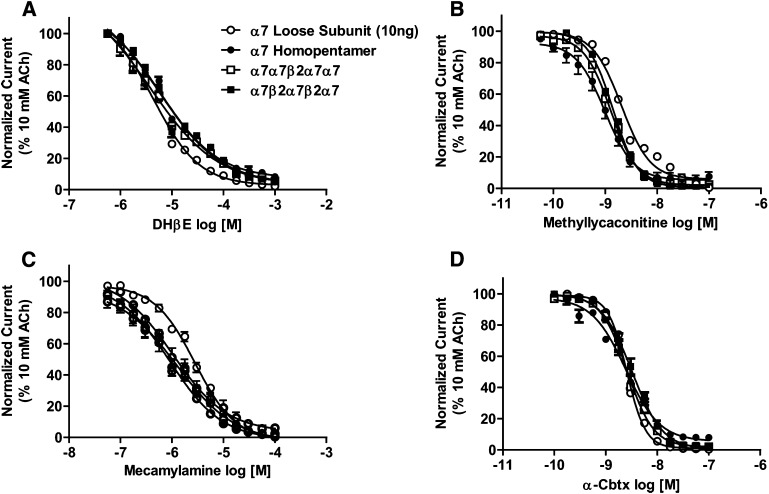
Fig. 5.
Antagonist concentration response profiles for α7- and α7β2-nAChRs. Oocytes were injected with mRNA encoding unlinked α7 subunits (○), concatenated α7 homopentamers (●), or concatenated α7β2 pentameric concatemers (□ indicates α7β2 nAChR with the β2 subunit in position 3; ▪ indicates α7β2 nAChR with the β2 subunit in positions 2 and 4). Before antagonists were applied to each oocyte, a control 10 mM ACh-evoked response was measured. Oocytes were preperfused with the following nAChR antagonists: DHβE (10−6.25 to 10−3; n = 3) (A), methyllycaconitine (10−10.5 to 10−7; n = 3) (B), mecamylamine (10−7.25 to 10−4; n = 3) (C), or α-Cbtx (10−10 to 10−7; n = 3) (D). The magnitudes of subsequent 10 mM ACh stimulations were compared with that of the initial control. Data points represent the mean ± S.E.M. Drug potency and efficacy parameters were calculated by nonlinear least-squares curve fitting to the Hill equation (see Materials and Methods). The resulting pharmacological parameters and statistical analyses are summarized in Table 5.

