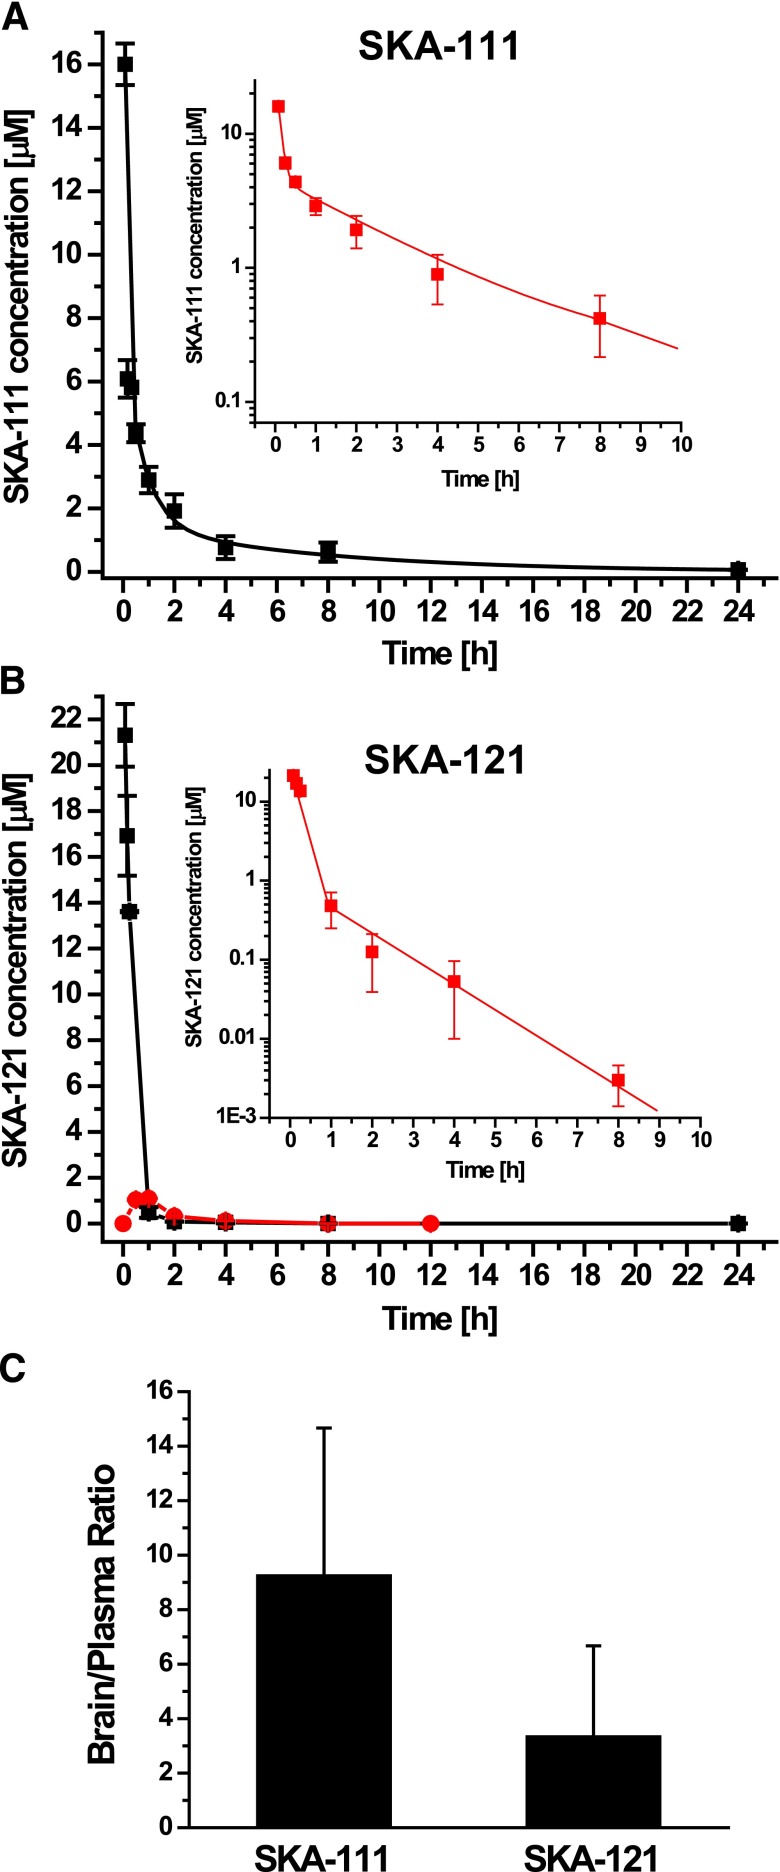
Fig. 7.
Pharmacokinetics of SKA-111 and SKA-121. (A) Total SKA-111 plasma concentration (mean ± S.D.) after i.v. administration of 10 mg/kg to mice (n = 2 to 3 per time point; t1/2 Distribution ∼2 minutes; t1/2 elimination = 4.7 ± 0.6 hours). Inset: The first 10 hours on a log scale. (B) Total SKA-121 plasma concentrations (mean ± S.D.) after i.v. (black) and oral (red) application of 10 mg/kg to mice (n = 3/time point; t1/2 ∼20 minutes; oral availability ∼25%). Inset: The first 10 hours after i.v. administration on a log scale. (C) Brain-to-plasma concentration ratios for SKA-111 and SKA-121 determined from multiple paired brain and plasma samples obtained during the experiments shown in (A) and (B) (n = 8 for SKA-111 and n = 5 for SKA-121).

