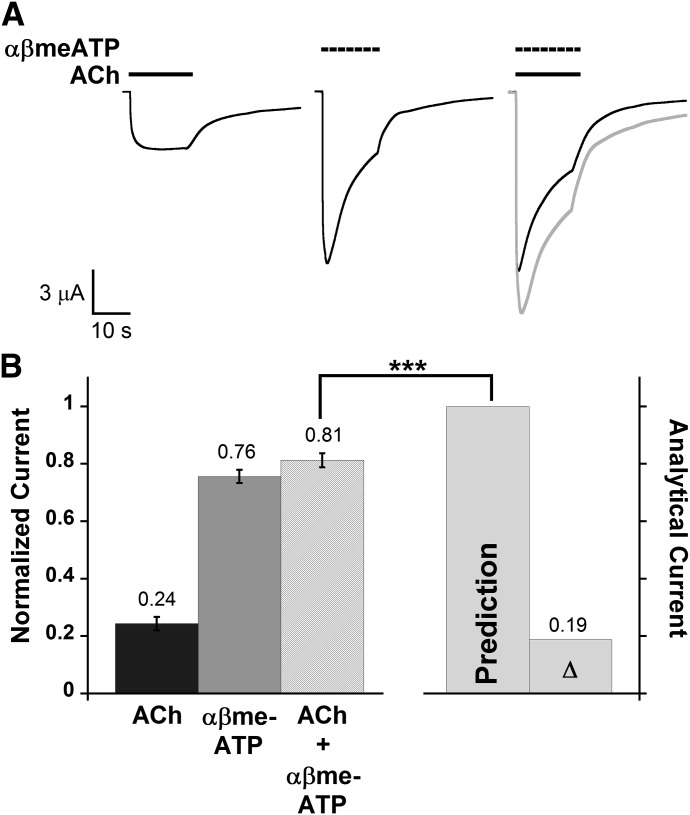
Fig. 6.
Functional interaction between the α6β4 nAChR and the heteromeric P2X2/3 receptor. (A) Representative traces upon application of ACh (100 μM), αβmeATP (100 μM), and ACh + αβmeATP mixture from the same oocyte are shown in black illustrating P2X2/3–α6β4 cross inhibition. Shown in gray is the predicted waveform, which is the point-by-point arithmetic sum of the IACh and IαβmeATP waveforms. (B) Mean normalized agonist-induced currents ± S.E.M. induced by applying ACh (100 μM), αβmeATP (100 μM), or ACh + αβmeATP to oocytes coexpressing α6β4 and P2X2/3 receptors (n = 9). All measured current signals were normalized to the predicted arithmetic sum of ACh- and αβmeATP-induced currents (“Prediction” column) of the same cell and then averaged. Mean current amplitudes ± S.E.M. are 3.25 ± 0.37 μA for ACh, 10.02 ± 0.58 μA for αβmeATP, and 10.82 ± 0.73 μA for ACh + αβmeATP. Δ is the mean difference between the prediction and the observed IACh+αβmeATP. The paired t test was performed to compare non-normalized IACh+αβmeATP data to the predicted values. Cross inhibition was observed from P2X2/3–α6β4 oocytes, as the observed IACh+αβmeATP was significantly smaller than the prediction. ***P < 0.0005.

