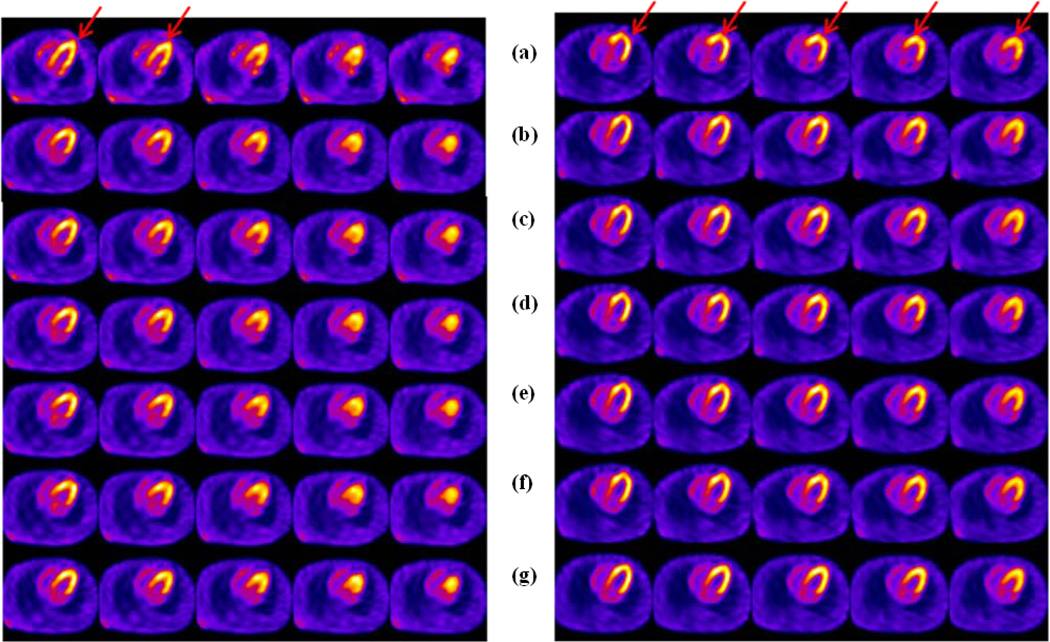
Figure 5.
NCAT phantom study with (Left) Complex motion and, (Right) Zthree Rotation from Table 1 for (a) uncorrected motion (b) corrected using MSD (c) corrected using NCC (d) corrected using PI (e) corrected using MI (f) corrected using NMI (g) corrected using the true motion. All cost functions are used with the data-driven Scheme B, without any prior initialization with the truth. All cost functions estimate the complex motion with errors of 4–7 mm, whereas failed to estimate the rotation about Z-axis accurately with errors up to 1 cm or more. The red arrows indicate the location of the artifacts due to motion. At the left the artifact appears as a distortion in the shape of the heart walls, whereas at the right the artifact is seen as a flattened apical region.

