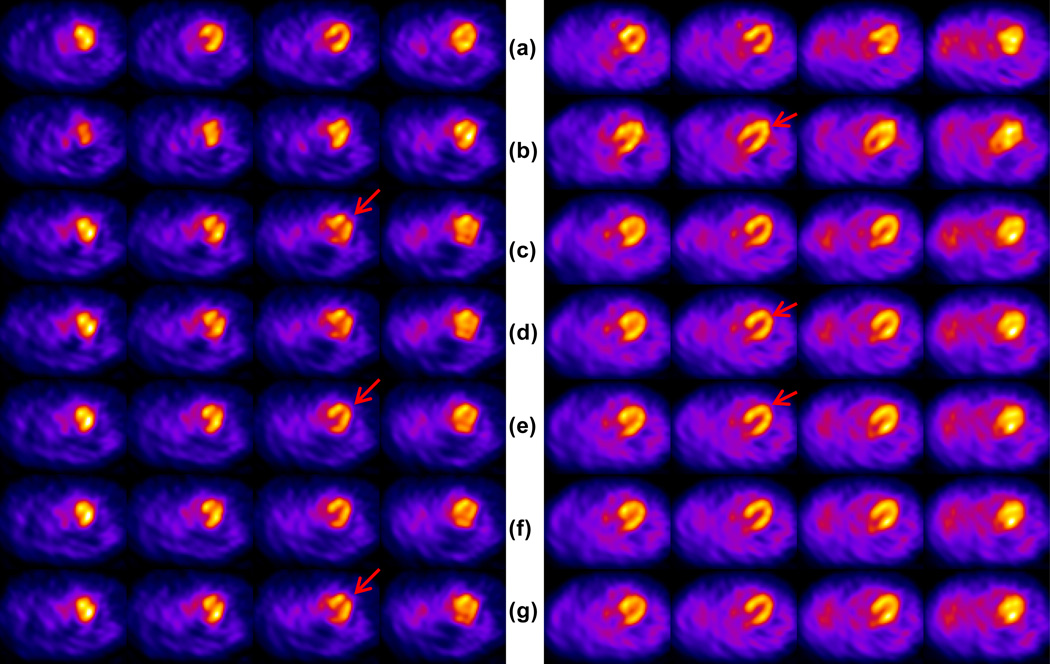
Figure 6.
Patient 1 (Left) and Patient 2 (Right) in Table 5. Rows (a) First rest study (b) Second rest study without correction (c) Second rest study corrected with the data-driven method using NMI as the cost function following Scheme B, without the aid of external motion tracking prior. (d) Second rest study corrected with the data-driven method using NMI as the cost function and external motion tracking prior following Scheme B. (e) Second rest study corrected with the data-driven method using PI as the cost function following Scheme B, without the aid of external motion tracking prior. (f) Second rest study corrected with the data-driven method using PI as the cost function and external motion tracking prior following Scheme B. (g) Same study corrected with external motion tracking estimates only. (Left) The red arrows indicate the artifactual slit at the apex due to motion, and better correction in rows (e) and (f) compared to other rows. (Right) The red arrows indicate the location of the artifact in row (b) showing elongated ventricular walls and recovery in other rows.

