Figure 9.

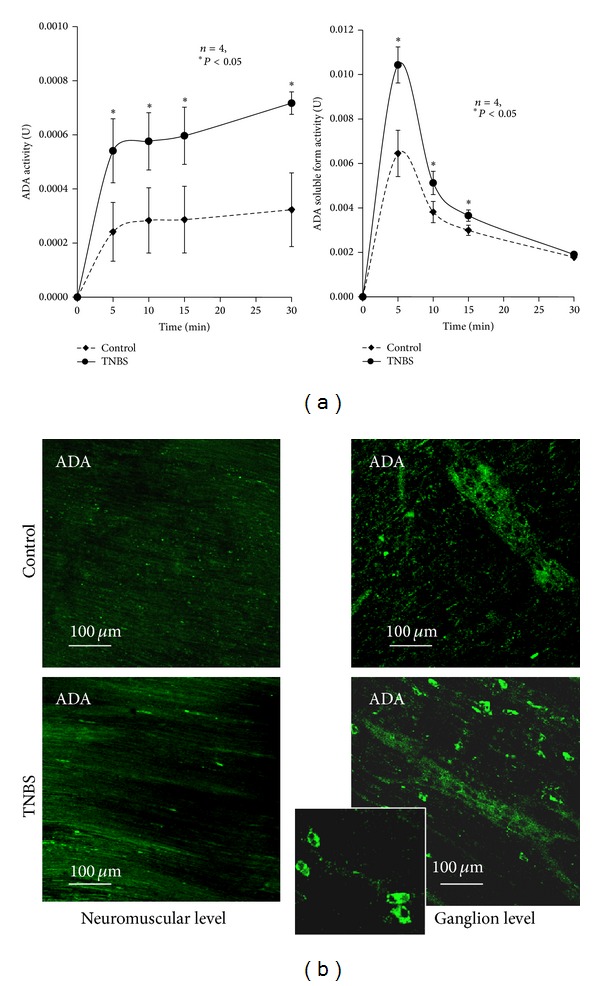
(a) Activity of ADA during the extracellular catabolism of adenosine in the LM-MP of the ileum of control and TNBS-injected rats. Adenosine (30 μM) was incubated at zero time. Average results obtained in four experiments; the vertical bars represent the SEM and are shown when they exceed the symbols in size. *P < 0.05 (one-way ANOVA followed by Dunnett's modified t-test) represent significant differences as compared to control animals. (b) Localization of ADA immunoreactivity in single confocal images of whole-mount preparations of the longitudinal muscle-myenteric plexus of the ileum of control and TNBS-injected rats, taken both at ganglia and neuromuscular layers. Please note that ADA immunoreactivity is much more exuberant in preparations from TNBS-treated rats than in control animals. The figure insert details ADA staining in mononuclear inflammatory cells infiltrating myenteric ganglia.
