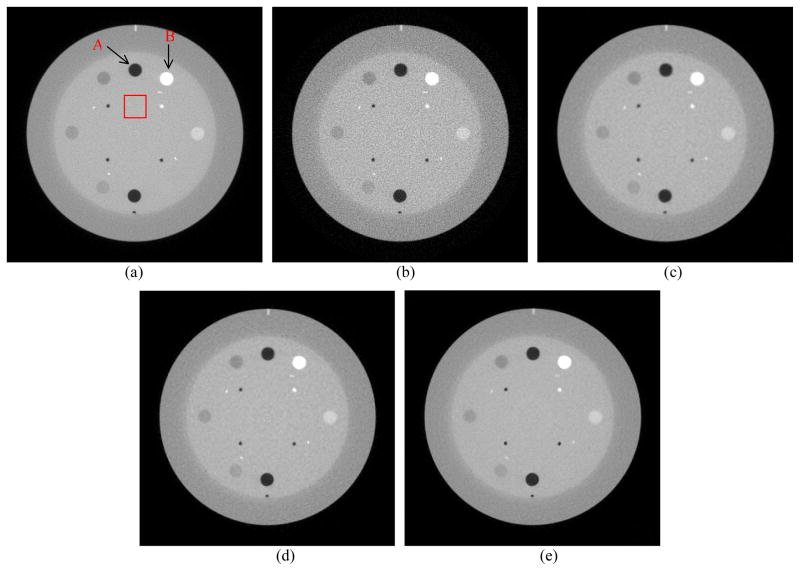
Figure 6.
A reconstructed slice of the CatPhan® 600 phantom: (a) FBP reconstruction from the 80mA sinogram. (b) FBP reconstruction from the 10mA sinogram; (c) SIR-GMRF reconstruction from the 10mA sinogram (β=2.5×10⁵); (d) SIR-GGMRF reconstruction from the 10mA sinogram (β=4.5×10³); (e) Proposed SIR-NLM reconstruction from the 10mA sinogram (β=2×10⁵, SW=17×17, PW=5×5, h=0.01). All the images are displayed with the same window.

