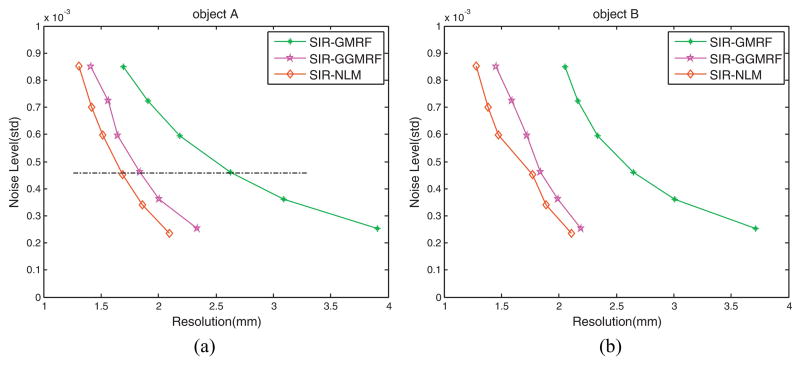
Figure 8.
Noise-resolution tradeoff curves for the three SIR methods: (a) Comparison of the noise-resolution tradeoff curves for reconstruction of the “negative” object A labeled in figure 6(a); (b) Comparison of the noise-resolution tradeoff curves for reconstruction of the “positive” object B labeled in figure 6(a).

