Figure 3.
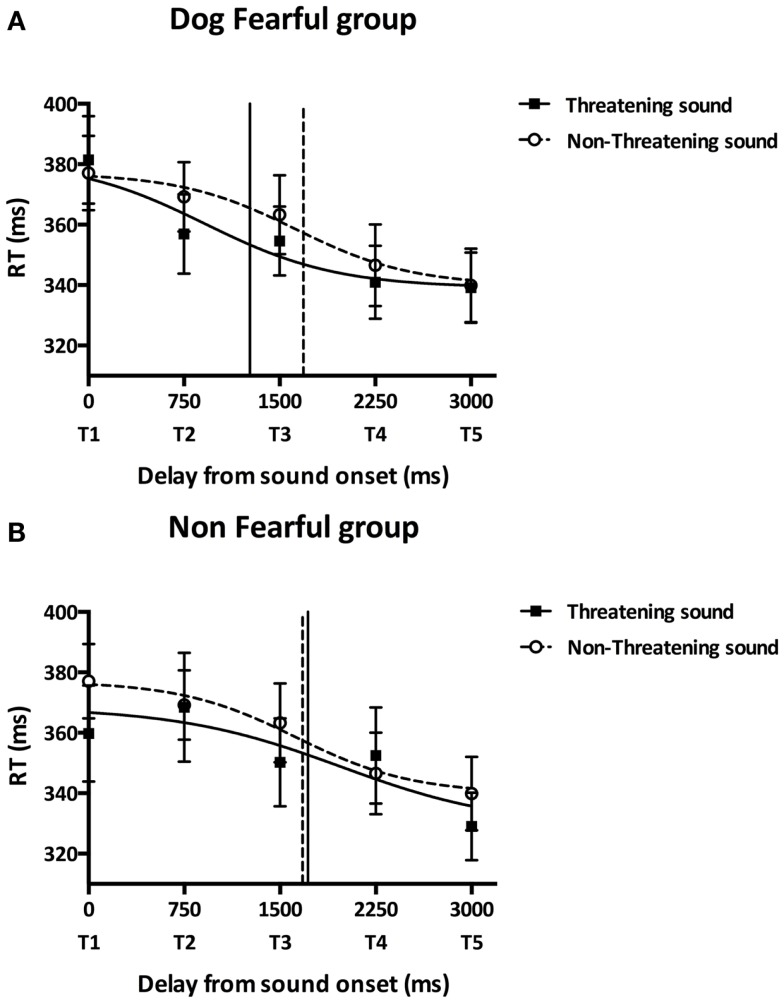
Main experiment results. Participants performed the audiotactile task by responding to a tactile stimulation while a task-irrelevant threatening (dog growling) or non-threatening (sheep bleating) sound was looming toward them. This figure reports the mean tactile reactions times (±SEM) for the dog-fearful (top graph) and non-fearful group (bottom graph) in the threatening (black square) or non-threatening (white circles) sound conditions as a function of the delay of tactile stimulation delivery from sound onset. Reaction times were fitted with a sigmoid function. The inflection point abscissa of the sigmoid curves was computed as a measure of the temporal delay, i.e., the distance, at which sound starts affecting tactile RTs and was analyzed in order to quantify PPS boundaries. (A) Dog-fearful group results. The abscissa of the curve’s inflection point was lower in the threatening sound condition (1266.81 ± 287.57 ms, black vertical line) compared to the non-threatening sound condition (1685.49 ± 548.41 ms, dashed vertical line) meaning that PPS boundaries were farther from participants in the presence of the dog sound than in the presence of the sheep sound. (B) Non-fearful group results. The abscissa of the curve’s inflection point did not significantly differ between the threatening (1717.70 ± 413.23 ms, black vertical line) and the non-threatening (1675.15 ± 596.56 ms, dashed vertical line) sound conditions suggesting that participants’ PPS size was similar in the presence of the dog and the sheep sounds. While the dog-fearful group’s PPS was larger than the non-fearful group’s PPS in the presence of the dog sound, there was no significant difference in PPS size between groups in the presence of the sheep sound.

