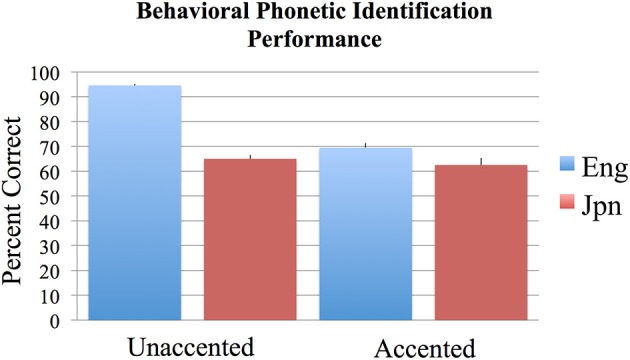
Figure 1.

Mean percent correct behavioral phonetic (/r/ vs. /l/) identification performance for the English (blue) and Japanese (red) groups for unaccented and foreign-accented speech. Standard error of the mean is given above each bar. All conditions were significantly above chance performance of 50%. See text for additional contrasts that were statistically significant.
