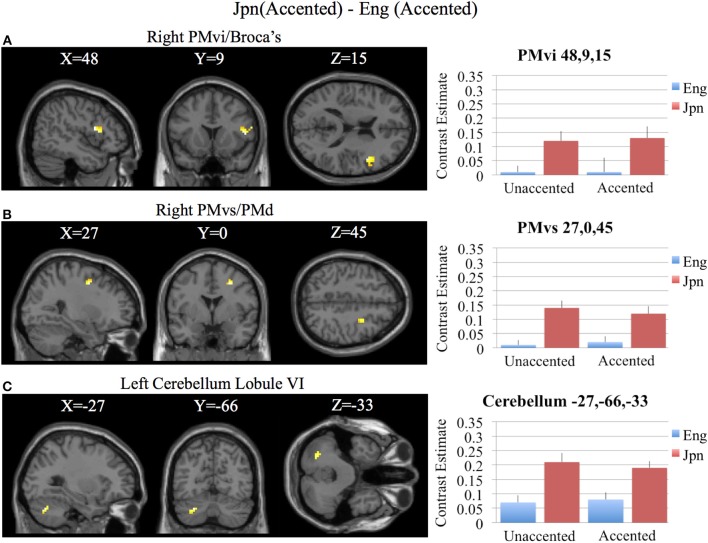
Figure 6.
Region of interest analysis for the contrast of Jpn(accented) – Eng(accented) using small volume correction (p < 0.05) for multiple comparisons. (A) Right PMvi/Broca's area. (B) Right PMvs/PMd. (C) Left Cerebellum Lobule VI. MNI X, Y, Z coordinates are given at the top of each brain slice. Negative × MNI coordinates denote left hemisphere and positive × values denote right hemisphere activity. The SPM contrast estimates and standard error relative to rest for all four conditions are given on the left side of each ROI rendered image.

