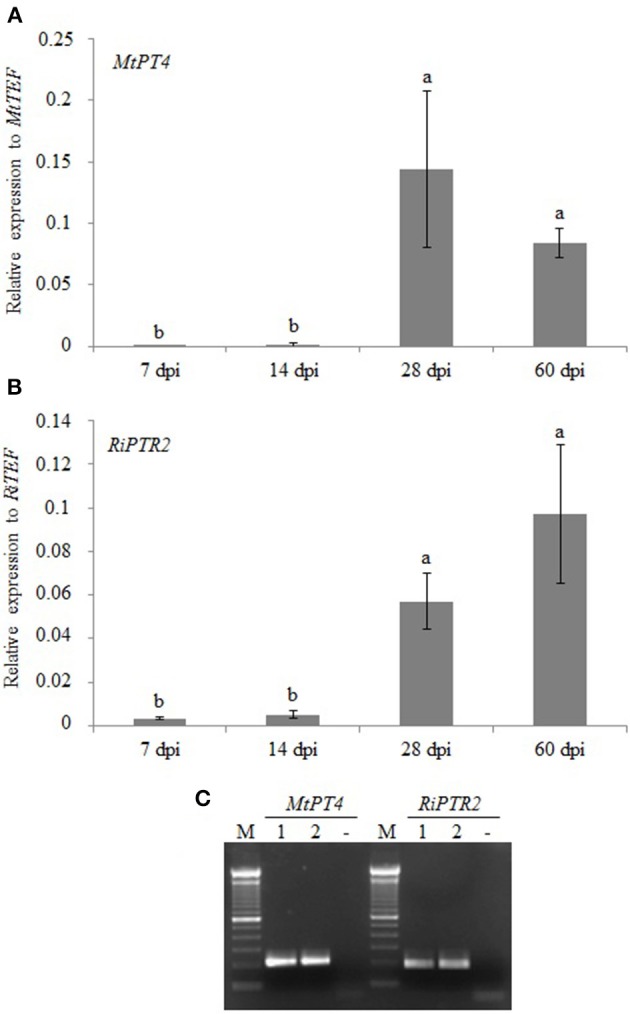
Figure 4.

Relative expression of MtPT4 (A) and RiPTR2 (B) assessed by qRT-PCR in a time course experiment of root colonization at 7, 14, 28 and 60 days post-inoculation (dpi). Data for each condition are presented as mean ± standard deviation. Different letters indicate statistically significant difference (p < 0.05, ANOVA). (C) Gel electrophoresis of RT-PCR products obtained from two independent samples (1, 2) of RNA from laser-microdissected arbuscule-containing cells using primers specific for MtPT4 or RiPTR2. No RNA sample (-); M: 100 bp (Invitrogen).
