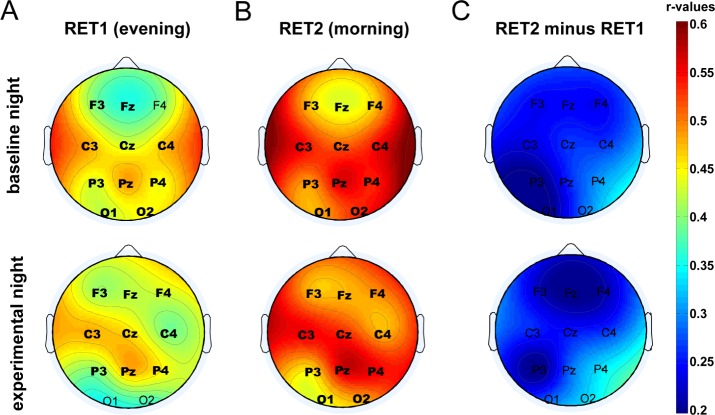
Figure 4.
Topographical maps representing Pearson correlation coefficients (color scaled) between recall performance (A) in the evening (RET1), (B) in the morning (RET2) as well as (C) overnight memory change (RET2 minus RET1) and slow spindle activity (SpA) both at baseline (upper row) and experimental (lower row) nights. Correlation values at electrode positions printed in bold remained significant after Bonferroni correction for multiple comparisons (P < 0.05/11 = 0.0045). RET, retrieval.

