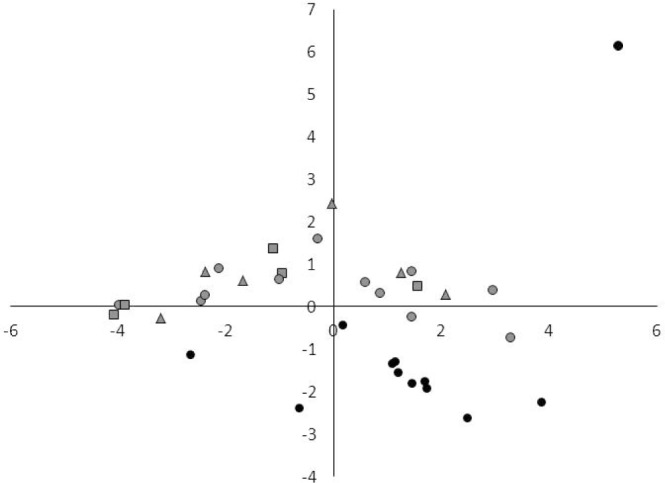
Figure 3.

Principal component analysis of miRNAs that were detected in all samples from patients with type 1 narcolepsy, type 2 narcolepsy, and idiopathic hypersomnia, and healthy controls. Normalized values were used for PCA. Gray circles: type 1 narcolepsy; gray triangles: type 2 narcolepsy; gray squares: idiopathic hypersomnia; black circles: healthy controls.
