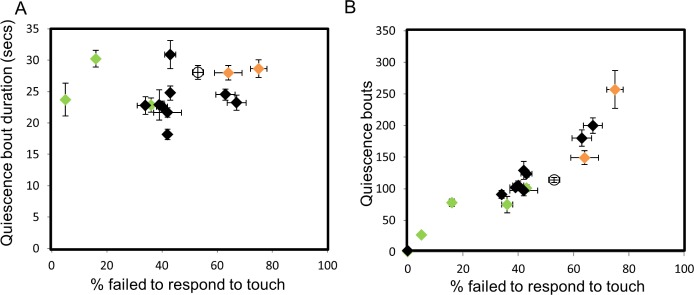
Figure 4.
Assessing correlations between arousal and quiescence. Quiescence bout number and bout duration during lethargus were examined versus arousal thresholds for genotypes tested in Figures 1 and 3. Wild-type is represented as an empty circle. Genes implicated in the dopamine signaling pathway are represented as green and orange rhombi, which represent decreased and increased quiescence, respectively. (A) No correlation was observed between quiescent bout duration and arousal thresholds (r = -0.051, P = 0.580). (B) A direct correlation was detected between quiescent bout numbers and arousal thresholds. Correlation coefficient r = 0.887, P = 1e-08. See Methods for statistical details.

