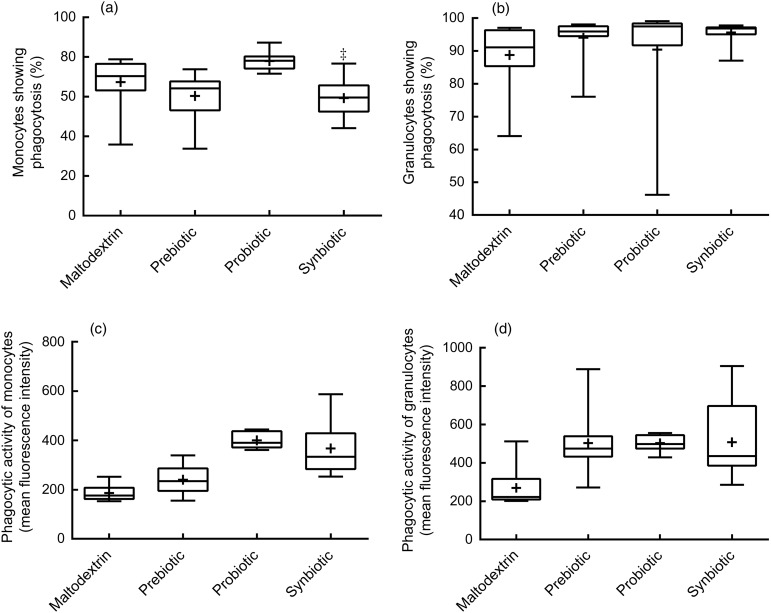
Fig. 2.
Phagocytic activity of monocytes and granulocytes. Phagocytic activity was measured using a flow cytometer after incubation of opsonised and fluorescence-labelled Escherichia coli in whole blood of the subjects. Percentage of monocytes (a) and granulocytes (b) of the total population that had phagocytosed E. coli. Phagocytic activity of monocytes (c) and granulocytes (d) measured as fluorescence intensity in individual cells that had phagocytosed E. coli. Statistical differences were calculated using linear model contrasts. Whiskers represent the minimum and maximum values; the box represents the 25th percentile, median and 75th percentile; + indicates the mean value. Mean value was significantly different from that of the maltodextrin group: *P = 0·02, **P < 0·001. Mean value was significantly different from that of the prebiotic group: †P = 0·005, ††P < 0·001.

