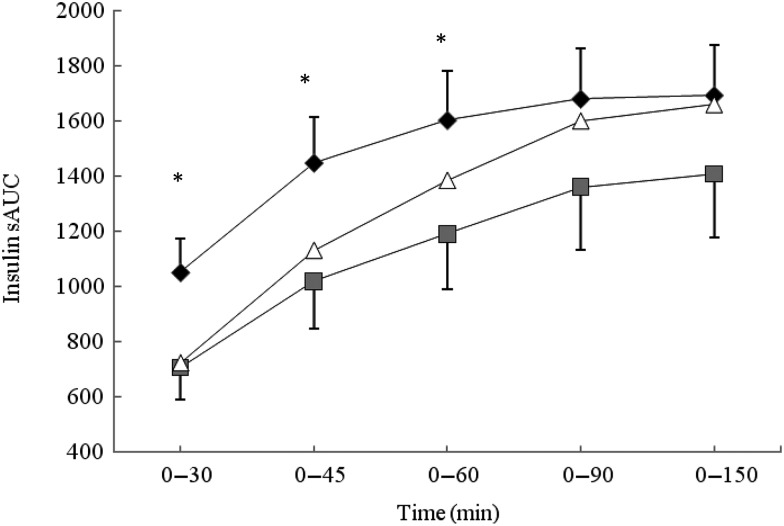
Fig. 2.
Segmental areas under the blood insulin response curve (sAUC). Values are means (n 16), with standard deviations represented by vertical bars. For clarity, negative error bars are shown for the beetroot beverage (BEET; ■) and positive error bars are displayed for the matched control beverage (MCON; ♦). Error bars are not displayed for the glucose beverage (GLUC; Δ) but were comparable in magnitude. * Mean value for BEET was significantly different from that for MCON (P < 0·05).

