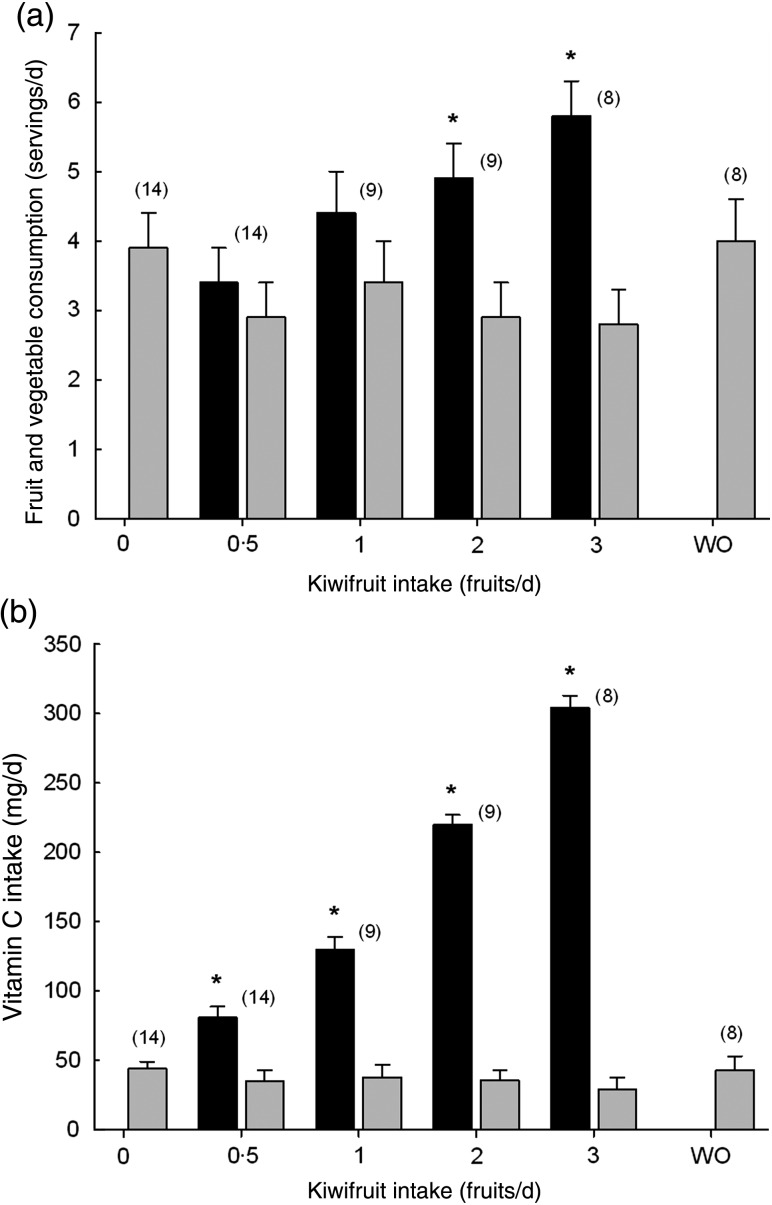
Fig. 2.
(a) Daily fruit and vegetable consumption and (b) vitamin C intake by the study
participants. (■), Total fruit and vegetable intake or vitamin C intake;
( ), total minus kiwifruit intervention.
Data are means, with standard errors represented by vertical bars. The numbers of
participants are indicated in parentheses. * Mean value was significantly different
from that at baseline (P < 0·05; one-way repeated-measures
ANOVA with the Fisher least significant deviation pairwise multiple comparison
procedure). WO, washout.

