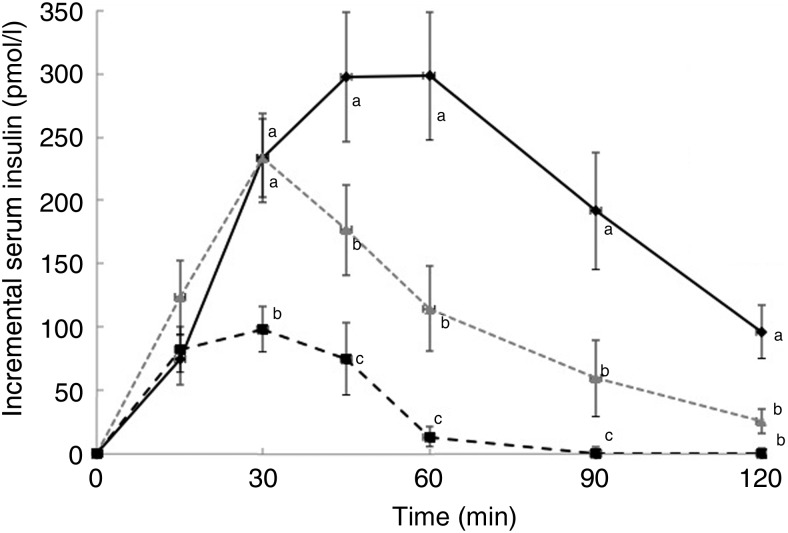
Fig. 3.
Postprandial insulin responses to three meals containing 50, 50 and 20 g of
available carbohydrates from white bread (♦), raisins ( )
and raisins (■), respectively. Values are means, with standard errors represented by
vertical bars. a,b,cMean values at a specific time point with unlike
letters were significantly different (P < 0·05).

