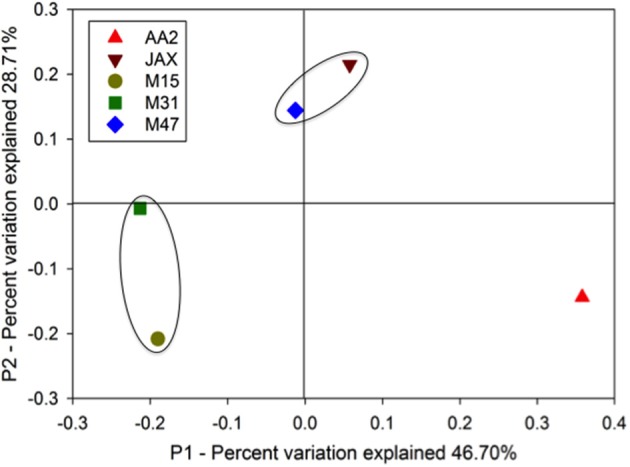
Figure 2.

Weighted and normalized PcoA plot of the DNRA communities in the New River Estuary. Unifrac analysis was conducted with representative NrfA OTUs in the five sediment communities. The black circles indicate the communities sharing higher composition similarities.
