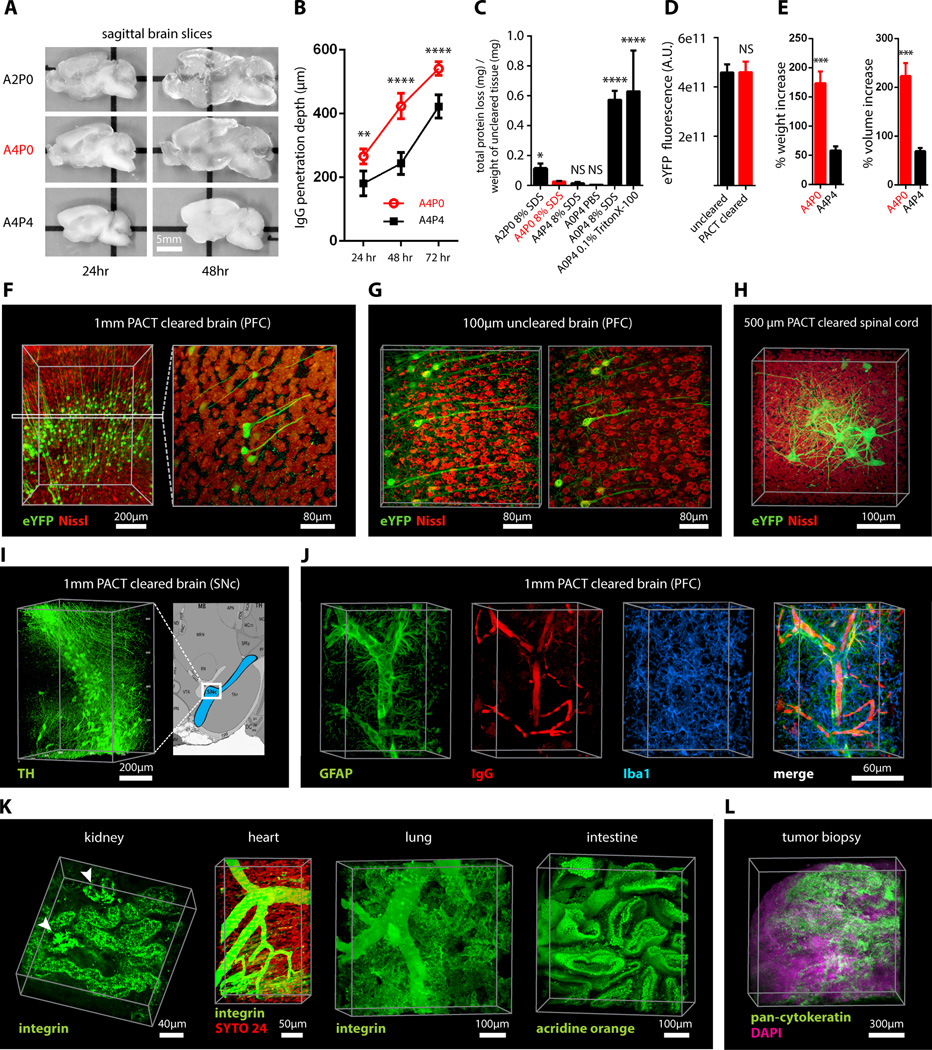
Figure 1. PACT clearing of A4P0 tissue-hydrogel hybrid achieves optimal transparency and immunohistochemistry compatibility across organs.
(A) Optical transparency comparison of 3 mm adult mouse sagittal blocks of A2P0, A4P0, and A4P4 tissue-hydrogel hybrid cleared for 24 h and 48 h. (B) Compared to A4P4, A4P0 tissue-hydrogel hybrid showed faster antibody penetration (n=6 fields of view per sample). (C) The percentage of protein loss from1 mm mouse brain slices (n=6 slices for each clearing condition); statistical significance is shown for each condition vs. A4P0 8% SDS (red). (D) The integrated eYFP fluorescence intensity in arbitrary units (A.U.) of uncleared and cleared 1 mm Thy1-eYFP mouse brain slices (n=6 slices). (E) Compared to A4P4, the A4P0 hydrogel-tissue hybrid showed higher tissue expansion and weight gain post clearing. (F–H) Thy1-eYFP mouse sections stained with Nissl: (F) 1 mm cleared brain slice, prefrontal cortex (PFC) area (left: z = 1 mm imaging stack depth); (G) 1 mm uncleared brain slice, PFC (left: z = 100 µm imaging stack depth); (H) 1 mm spinal cord slice (z = 500 µm). (I) Substantia nigra pars compacta (SNc) of 1 mm mouse brain slice stained with anti-tyrosine hydroxylase (TH) antibody (z = 1 mm). (J) PFC of 1 mm adult mouse brain slices stained with antibodies against GFAP, mouse-IgG, and Iba1 (z = 1 mm). (K) 1 mm section of mouse kidney (z = 150 µm; arrowheads show glomeruli), heart (z = 320 µm), lung (z = 550 µm) and intestine (z = 350 µm) stained with anti-integrin antibodies, SYTO24, and acridine orange. (L) PACT-cleared human tissue biopsy from basal cell carcinoma (BCC) was stained with anti-pan-cytokeratin (AE1/AE3) Alexa Fluor 488 primary antibody to label endothelial cells and DAPI (700 µm imaging stack depth). All graphs are shown in mean ± SEM Statistical significance: for paired samples: 2-tailed Student’s t test; for multiple comparisons: one-way ANOVA followed by Bonferroni posthoc (*p < 0.05, **p < 0.01, ***p < 0.005, and ****p < 0.0001). All confocal imaging; for objectives see Supplemental Methods. Also see Figure S1–3 and Tables S1–2.

