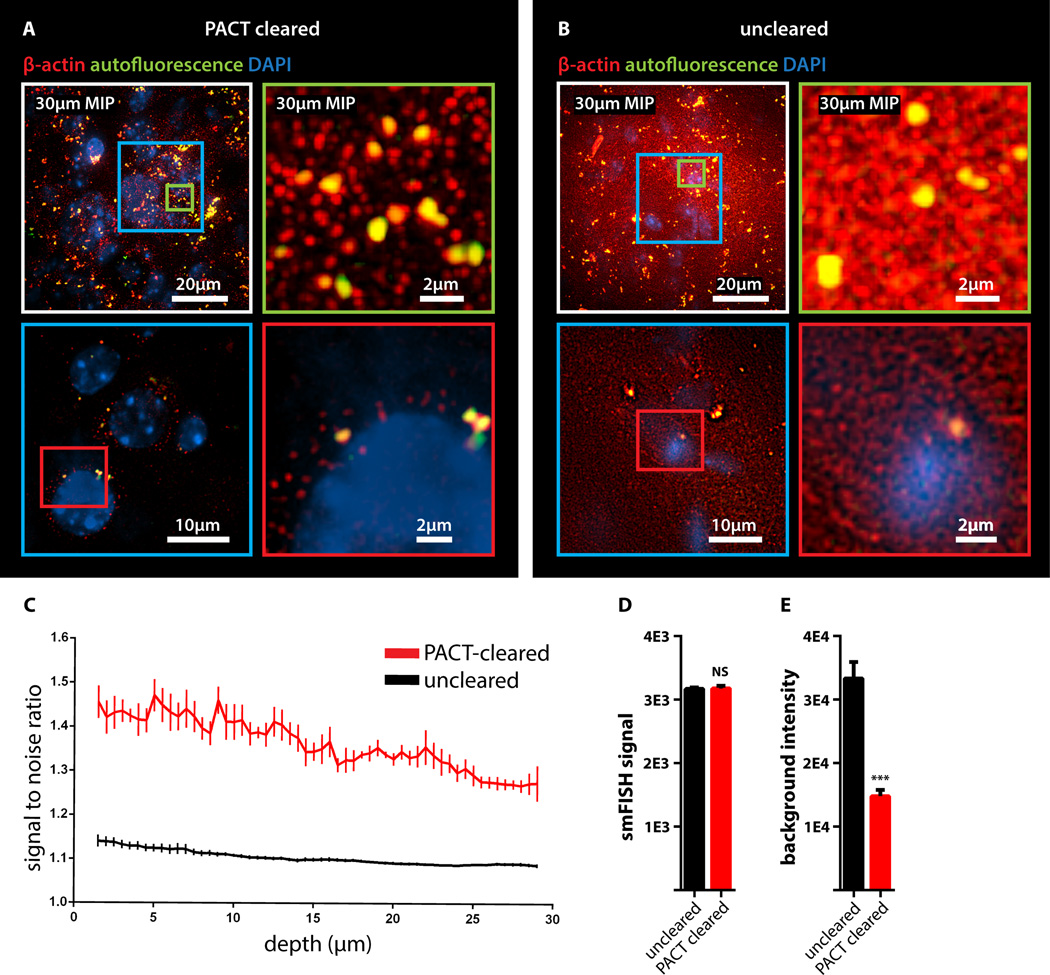
Figure 2. Detection of individual mRNA transcripts in PACT tissue sections by smFISH.
100µm-thick mouse brain slices were hybridized with twenty-four 20mer oligonucleotide probes towards β-actin mRNA labeled with Alexafluor 594. (A) PACT-cleared smFISH brain slices. Upper panel shows 30 µm maximum intensity projection. An abundant number of diffraction limited spots corresponding to single beta-actin mRNAs (red) were readily detected up to 30 µm in depth under 589nm illumination. Note bright amorphous granules (yellow) are background lipofuscin vesicles that show up in both 589nm(red) and 532nm autofluorescence (green) channels, whereas smFISH signals are in the red channel only. (B) Compared to PACT cleared slices, smFISH in uncleared brain slices showed significantly decreased contrast. (Lower panels in A and B show single slices of 0.5 um at 12 um depth; the images were processed from raw data using the same contrast scale and Laplacian of Gaussian filtering; for raw data see Figure S2D) (C) Signal to noise ratio as a function of depth shows PACT-clearing tissue increases the signal to noise ratio of smFISH throughout the thickness of the sample as compared to uncleared tissue. (D) smFISH intensities show no appreciable differences between uncleared and PACT-cleared tissue. p = 0.8722; 2-tailed Student’s t test. (E) Comparison of background intensity between uncleared and PACT-cleared tissue illustrates the significant reduction of background fluorescence in PACT-cleared tissue. p = 0.0006; 2-tailed Student’s t test. All graphs are shown in mean ± s.d. For microscopy see Supplemental Methods.

