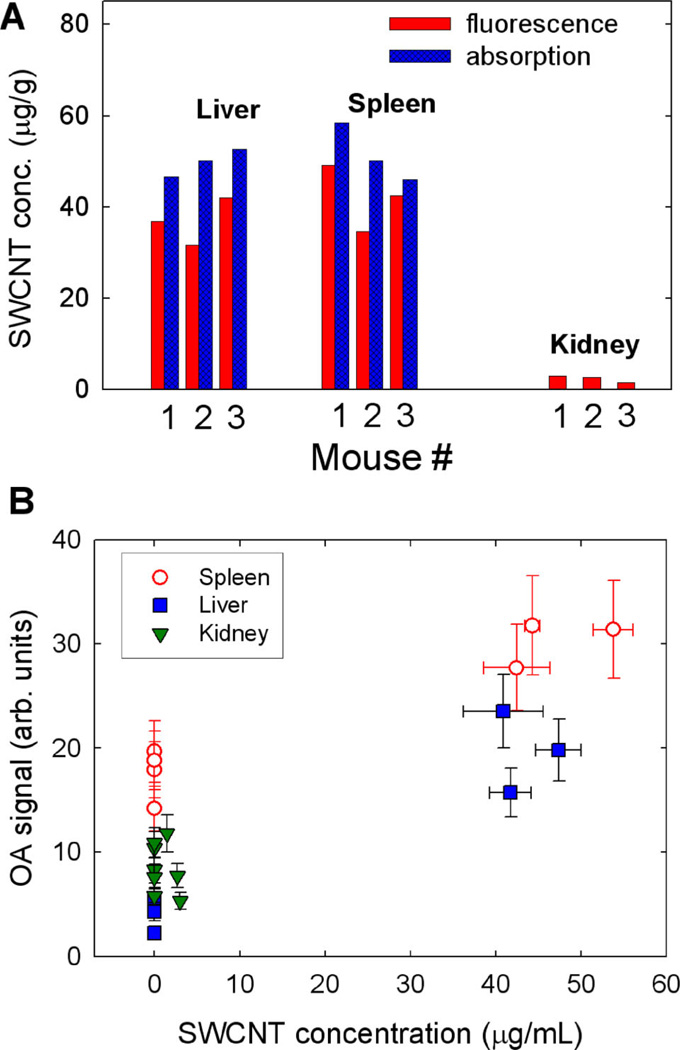
Figure 6.
(A) Concentrations of SWCNTs in organs of mice measured 3 days after injection. (B) Correlation of OA signals from organs of 4 mice with the measured concentrations of SWCNTs accumulated in these organs. Vertical error bars show the estimated measurement error of OA organ brightness. Horizontal error bars show the discrepancy between concentration measurements via SWCNT absorption and fluorescence.

