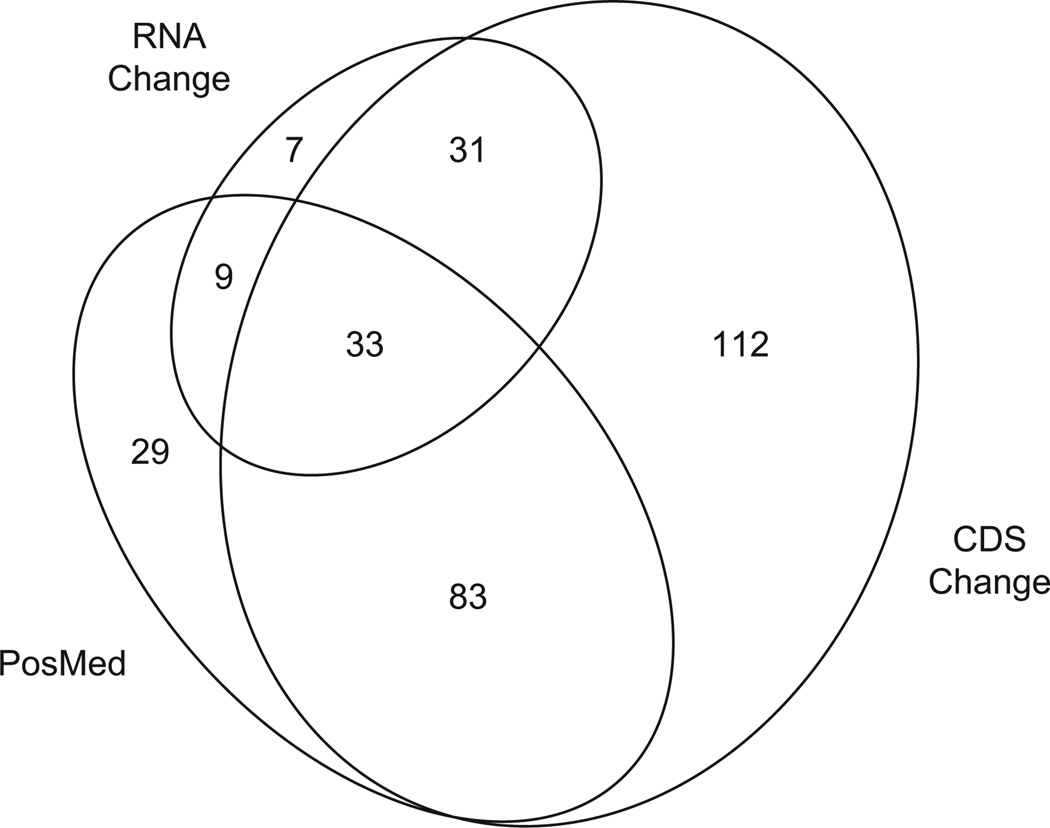
Fig. 4.
Area-proportional diagram showing the intersection of gene subsets derived by filtering 385 annotated genes within the Rd6m1 modifier locus. The subsets include genes with nucleotide changes in CAST/EiJ compared to C57BL/6J that are likely to affect protein coding (CDS Change, obtained with the Sanger Mouse Genomes Project query tool); genes with a semantic link to the postulated function or tissue expression of Mfrp (PosMed); and retinal genes that are differentially expressed (Q value of false discovery rate <0.05) in C57BL/6J compared to CAST/EiJ (RNA Change, obtained from reevaluation of microarray data (Jelcick et al., 2011)). The number of genes in each area of the diagram is indicated. Proportioned ellipses were generated with eulerAPE v2.0.3 (http://www.eulerdiagrams.org/eulerAPE/).

