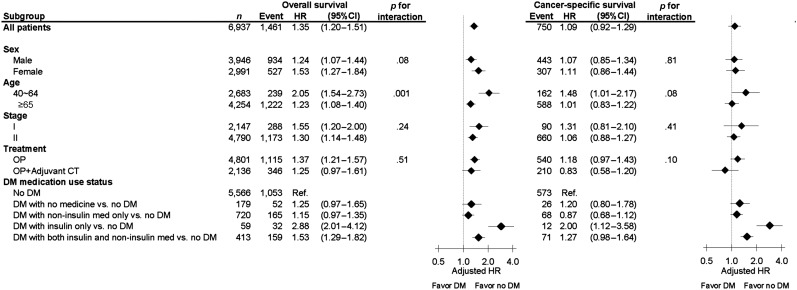
Figure 3.
Subgroup analysis of adjusted hazard ratios of mortality for DM vs. no-DM using the Cox proportional hazard model (the no-DM group as the reference). Every analysis was adjusted for all the other factors not involving the subgroup, including gender, age, tumor stage, treatment (surgery vs. surgery + adjuvant chemotherapy), cirrhosis, and all other comorbidities listed in Table 1.
Abbreviations: CI, confidence interval; CT, chemotherapy; DM, diabetes mellitus; Favor no DM, hazard ratios favoring patients without DM to have better survival outcomes; HR, hazard ratio; OP, surgery.

