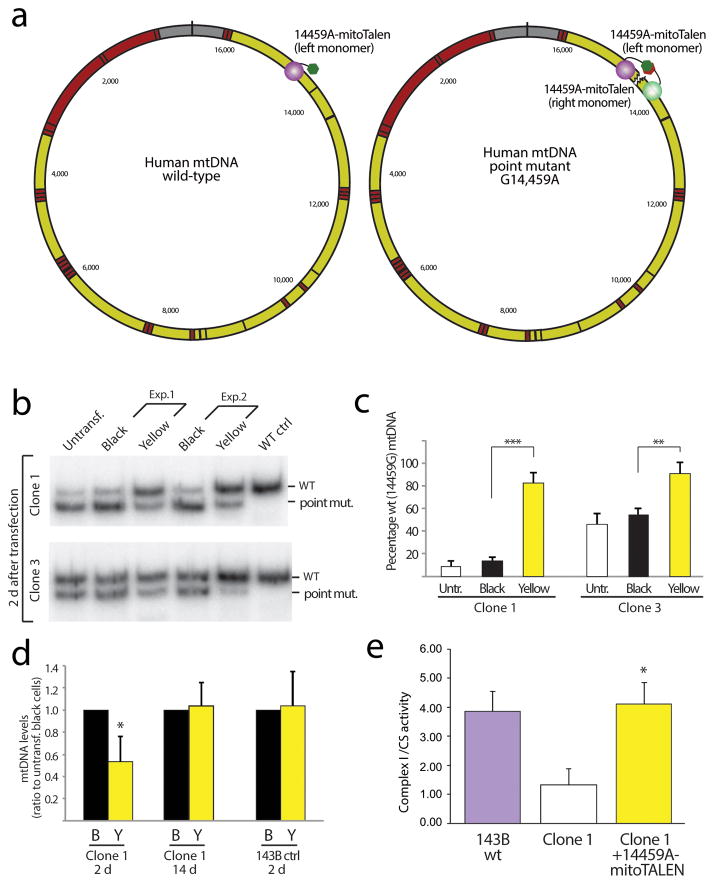
Figure 2. Using mitoTALEN to reduce the levels of the pathogenic m.14459A mtDNA point mutation.
(a) Approach for the elimination of a point mutant (m.14459G>A). In this case, one of the mitoTALEN monomers binds to wild–type sequence (left monomer) and the other to sequence containing the point mutation within the MT–ND6 gene (right monomer). (b) Cybrids harboring the Leber’s–dystonia m.14,459A mtDNA mutation (Clones 1 and 3) were transiently transfected with 14459A–mitoTALEN expressing plasmids (Exp.1 and 2). Clone 1 harbors approximately 90% m.14459A whereas clone 3 harbors approximately 55%. The panel shows the RFLP analysis of the mutation load in the “black” and “yellow” cells 48 hours after transfection FACS sorted as shown in Fig. 1d. Quantification of n=3 independent experiments is shown (c). Untr=untransfected cells. (d) Quantitation of the total mtDNA levels by qPCR showed a decrease in clone 1 two days after transfection, but not at 14 d. Likewise, wild–type control 143B cells did not show a decrease in mtDNA levels, even after 2 d. (e) Enzyme activity (complex I/citrate synthase ratio) in control, mutant and mutant cells transfected with the 14459A mitoTALEN (14 d after transfection). (t–Test unpaired between “black” and “yellow” values; n=3; * P = <0.005, ** P = <0.002, *** P = <0.001). Error bars correspond to SD of the mean.

