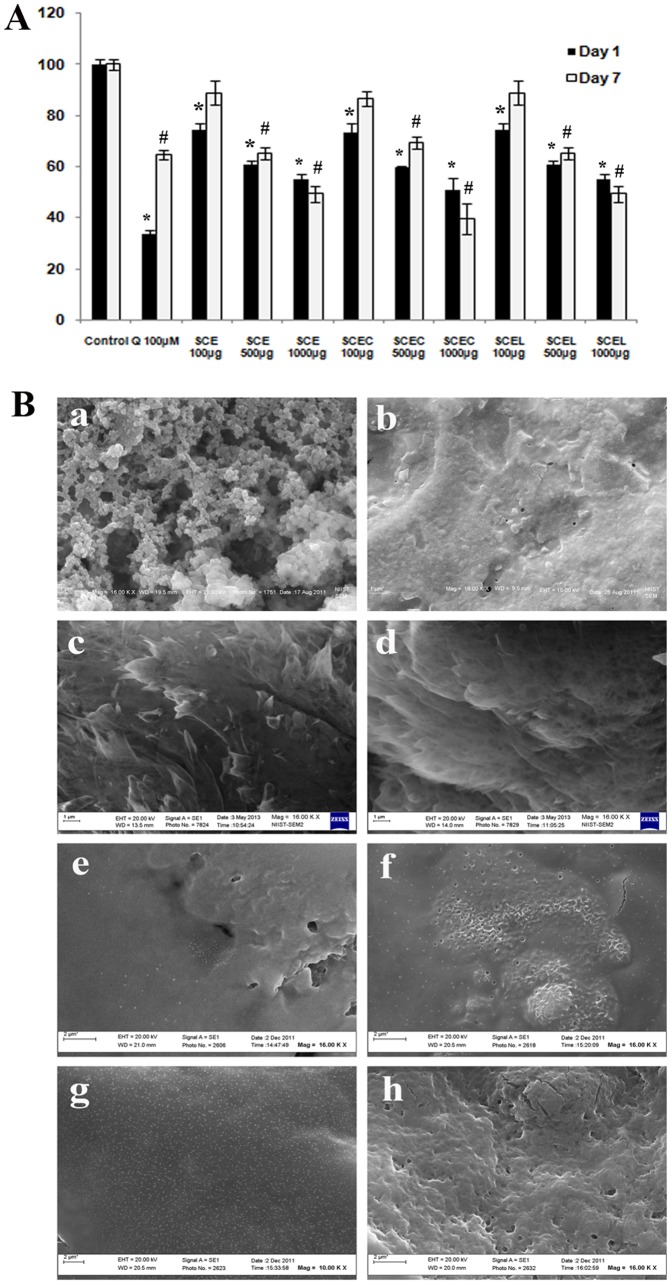
Figure 3. Fluorescence quantification and SEM microstructure analysis of advanced glycation end products revealed the antiglycation property of SCE SCEC and SCEL.
(A) Quantification of fluorescence intensity of glycated products in presence of various concentrations of SCE, SCEC and SCEL (100, 500, 1000 µg/mL) under 2 different time intervals (day1 & day7) in terms of relative fluorescence units (RFU). Quercetin (100 µM) was used as reference compound. RFU are normalized to 100. Values are means ± SD; n = 3. *represents groups differ significantly from day 1 control group (P≤0.05) and ≠represents groups differ significantly from day 7 control group (P≤0.05). (B) Representative SEM microstructures of glycated products formed under various groups of day1 experiments (a–h), (a, control; b, quercetin 100 µM, c & d, SCE 100 µg/mL and SCE 1000 µg/mL; e & f, SCEC 100 µg/mL and SCEC 1000 µg/mL and g & h, SCEL 100 µg/mL and SCEL 1000 µg/mL. All samples were visualized at 16000× magnification.

