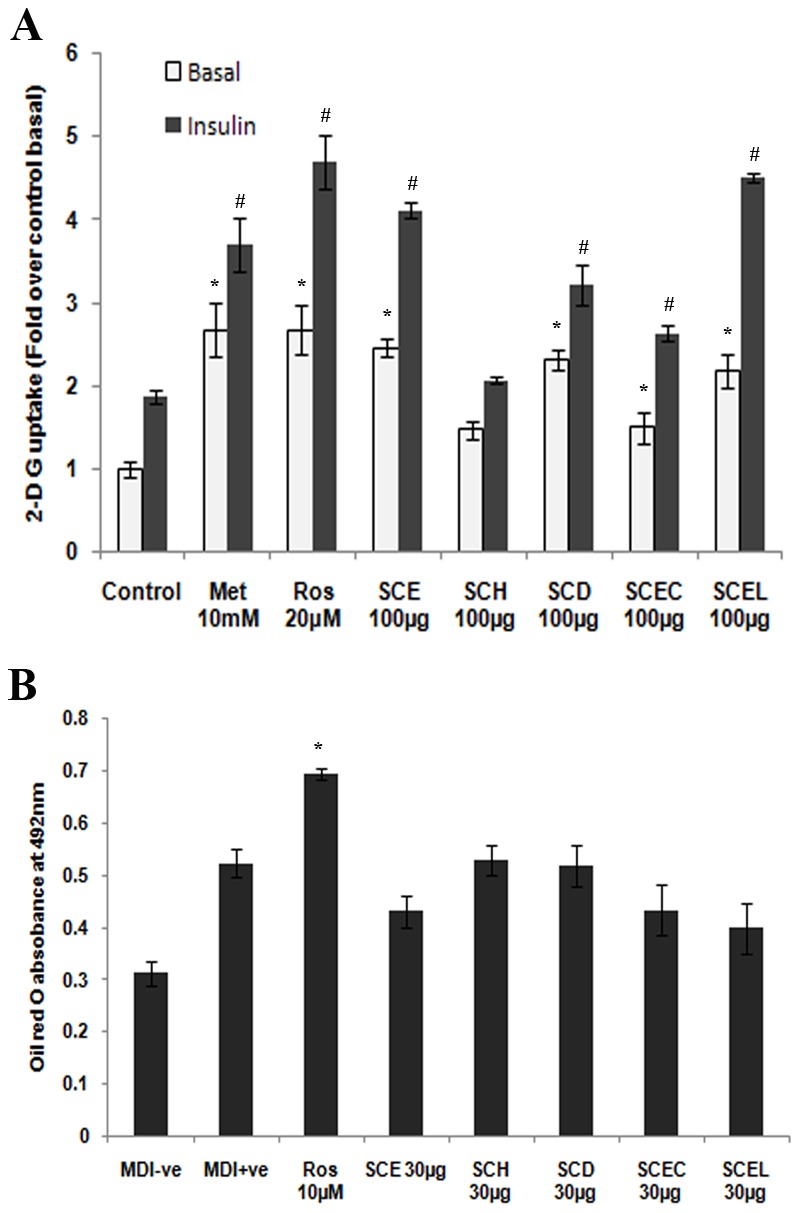
Figure 6. Glucose uptake and adipocyte differentiation studies in all 5 extracts.

(A) 2-deoxy glucose uptake in L6 myotubes. Cells were incubated for 16 h with different extracts (100 µg/mL) or standards. After incubation myotubes were left untreated (white bars) or stimulated with 100 nM insulin (black bars) for 20 min, followed by the determination of 2-DG uptake. Results are expressed as fold stimulation over control basal. Metformin (10 mM) & rosiglitazone (20 µM) were the standards. Values are means ± SD; n = 3. *represents groups differ significantly from basal control group (P≤0.05). ≠represents groups differ significantly from insulin control group (P≤0.05). (B) Quantification of triglyceride content in differentiating 3T3-L1 adipocytes treated with different extracts (30 µg/mL) or rosiglitazone (10 µM) for 8 days by oil red O staining. Data are expressed as the means ± SD; n = 3; * represents groups differ significantly from MDI positive group (P≤0.05). MDI−ve, media without 3-isobutyl-1-methylxanthine (IBMX), dexamethasone & insulin; MDI+ve, media with IBMX, dexamethasone & insulin and Ros 10 µM, rosiglitazone 10 µM.
