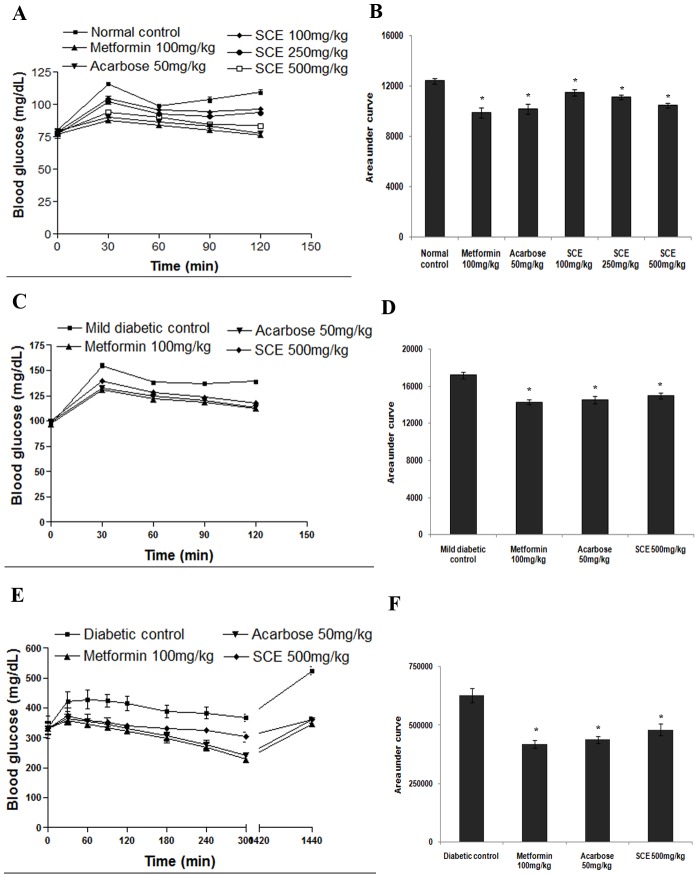
Figure 8. The antihyperglycemic effect of SCE in normal rats, mild diabetic rat model (SLM) and streptozotocin-induced diabetic rat model (STZ-S) after sucrose administration.
(A) The glycemic response curve and (B) incremental AUC0–120 min in normal rats. (C) The glycemic response curve and (D) incremental AUC0–120 min in SLM model. (E) The glycemic response curve and (F) incremental AUC0–1440 min in STZ-S model. Data are expressed as the mean ± SD, n = 6. * represents groups differ significantly from control group (p<0.05). SCE, S. cochinchinensis (SC) ethanol extract.

