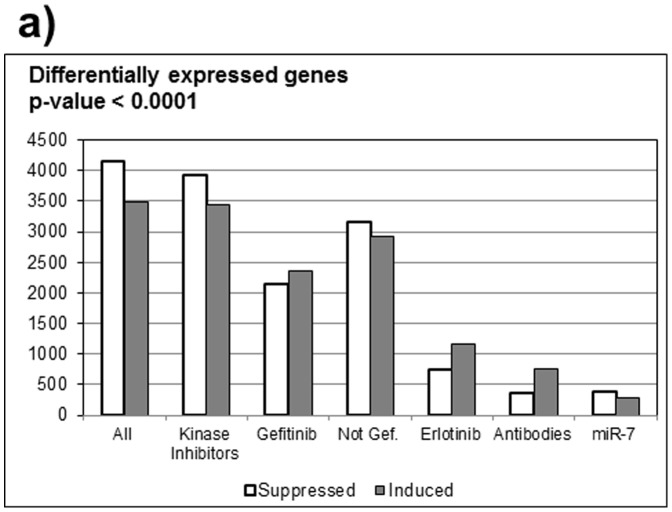
Figure 2. Metaanalysis identifies genes regulated by EGFR inhibitors.
Bar graph showing numbers of genes identified as differentially expressed with p-values 10−4 or better on different platforms, or using different EGFR inhibitors. Note that for miR-7 p-value 10−3 was used as the cut-off because only 10 samples were available.

