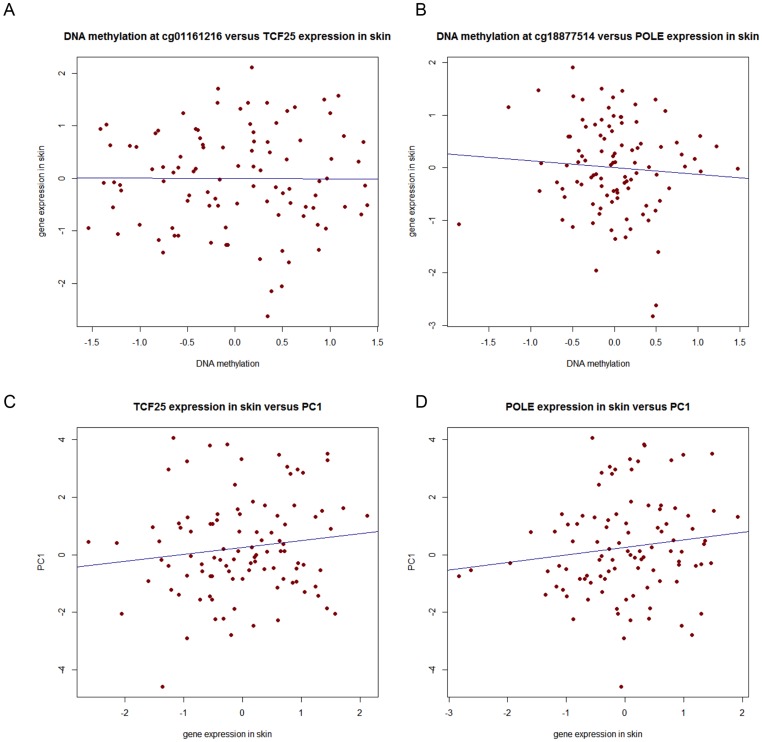
Figure 4. Effect of DNA methylation on gene expression in skin and effect of gene expression on PC1. A.
. DNA methylation residuals showed a weak negative correlation (r = −0.02) with expression residuals of TCF25 in skin samples. Both quantile normalised DNA methylation betas and quantile normalised gene expression values were adjusted for experimental batch effects (chip and position on the chip for methylation betas and experimental batch and RNA concentration for gene expression profiles) previous to analysis. The regression line (blue line) depicts the linear association between DNA methylation residuals and gene expression residuals. B. DNA methylation residuals at probe cg18877514 were weakly negatively correlated (r = −0.06) with POLE expression residuals in skin tissue. Both quantile normalised DNA methylation betas and quantile normalised gene expression values were adjusted for experimental batch effects (chip and position on the chip for methylation betas and experimental batch and RNA concentration for gene expression profiles) prior to analysis. The regression line (blue line) depicts the linear association between DNA methylation residuals and gene expression residuals. C. TCF25 expression residuals in skin showed a weak positive correlation (r = 0.12) with PC1. Quantile normalised gene expression values were adjusted for experimental batch effects and RNA concentration. The regression line (blue line) depicts the linear association between gene expression residuals and PC1 values. D. POLE expression residuals in skin showed a weak positive correlation (r = 0.16) with PC1. Quantile normalised gene expression values were adjusted for experimental batch effects and RNA concentration. The regression line (blue line) depicts the linear association between gene expression residuals and PC1 values.

