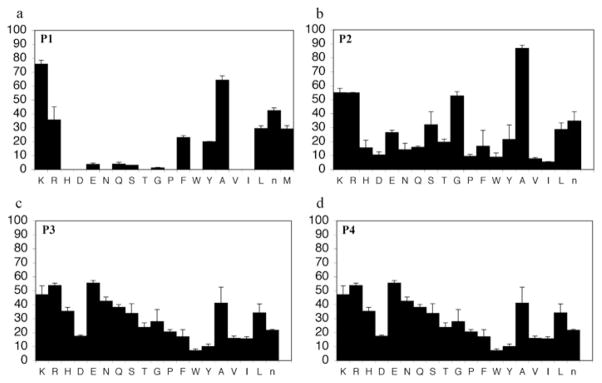
Figure 1. Subsite preferences of TTR as determined by combinatorial P-diverse libraries.

(a) P1 preference; (b) P2 preference; (c) P3 preference and (d) P4 preference. The y-axis represents the substrate-cleavage rates in picomolar concentrations of fluorophore released per second. The x-axis indicates the amino acid held constant at each position, designated by the one-letter code; n = norleucine. Results are means ± S.D.
