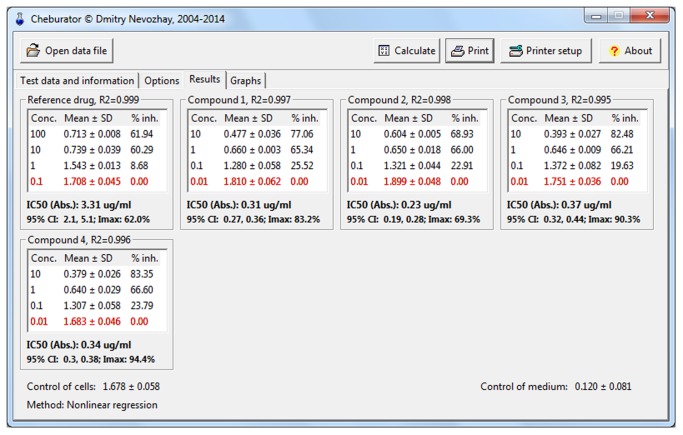
Figure 7. The Results tab after the analysis.
It is showing the dose range applied, mean and standard deviations of absorbance values for every triplicate, calculated respective percentages of inhibition of cell proliferation, estimated IC50 values, its type, method of calculation, and 95% confidence intervals (for regression analysis).

