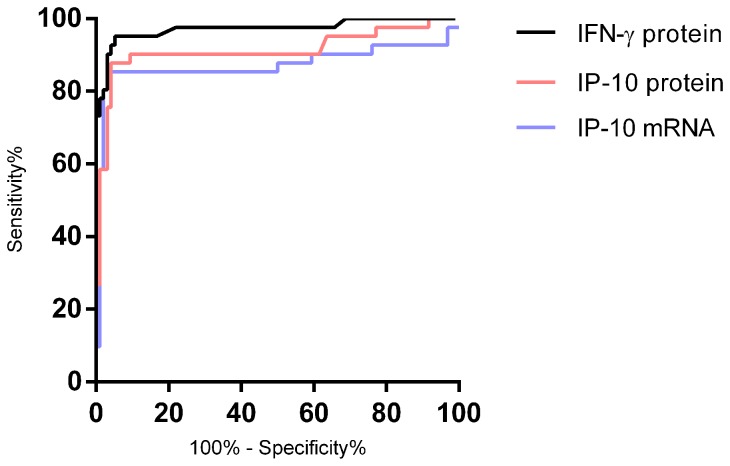
Figure 5. Comparison of the diagnostic potential of IP-10 RT-qPCR, IP-10 protein and IFN-γ protein.
ROC curve comparison of antigen-specific IP-10 mRNA expression and IP-10 and IFN-γ protein release. Cases comprised 30 TB patients and 13 LTBI persons and controls were 96 persons with no known exposure to M. tuberculosis. IP-10 gene expression was analysed from DBS and IP-10 and IFN-γ protein levels were analysed in plasma samples. AUCs was comparable at 0.88, 0.91 and 0.97 for IP-10 mRNA, IP-10 protein and QFT-TB respectively (p<0.0001). Cut offs were selected at the point rendering high sensitivity without compromised specificity.

