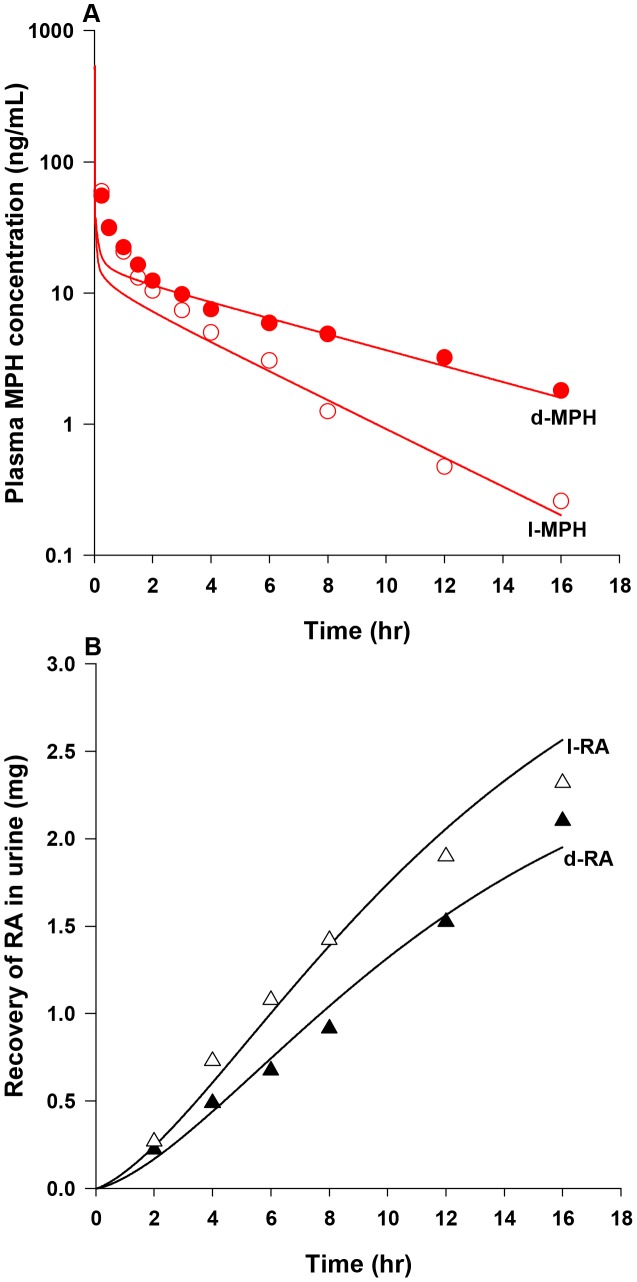
Figure 3. Plasma concentrations and urinary excretion data obtained after iv dosing of healthy adult men with MPH.
Panel A: data represent model simulated (lines) and observed (circles) plasma concentrations of d-MPH (•) and l-MPH (○) after iv dosing with 10 mg MPH (n = 13) [4]; Panel B: data represent simulated (lines) and observed (triangles) urinary excretion of d-RA (▴) and l-RA (Δ) after iv dosing with 10 mg MPH (n = 9) [28]. Observed data were digitalized from graphs and are expressed as mean or mean ± SD based on the ability to digitalize: this applies to all figure legends unless otherwise specified.

