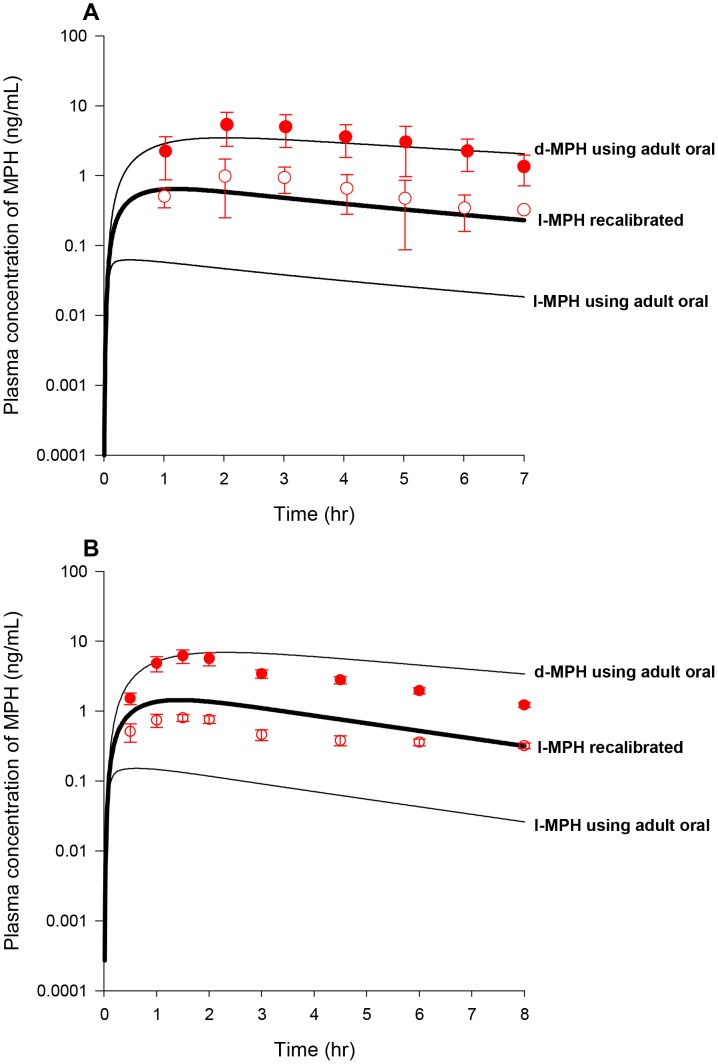
Figure 6. Plasma concentrations obtained after oral dosing of boys with MPH.
Panel A: Data represent model simulated (lines) and observed (circles) plasma concentrations of d-MPH (•) and l-MPH (○) after oral dosing with10 mg MPH in boys with ADHD (n = 9) [7]; Panel B: Data as described for Panel A obtained after oral dosing with 10 mg MPH in boys with ADD (n = 5) [46]. Thin lines depict model simulations with MPH-specific model parameters set to adult values, and thick lines represent model predictions of plasma l-MPH concentrations with the calibrated children oral model, for which the value of K5lC describing gut metabolism of l-MPH was decreased from the adult value of 1.426 to 0.1 1/h/kg0.75, while other MPH-specific model parameters were set to adult values.

