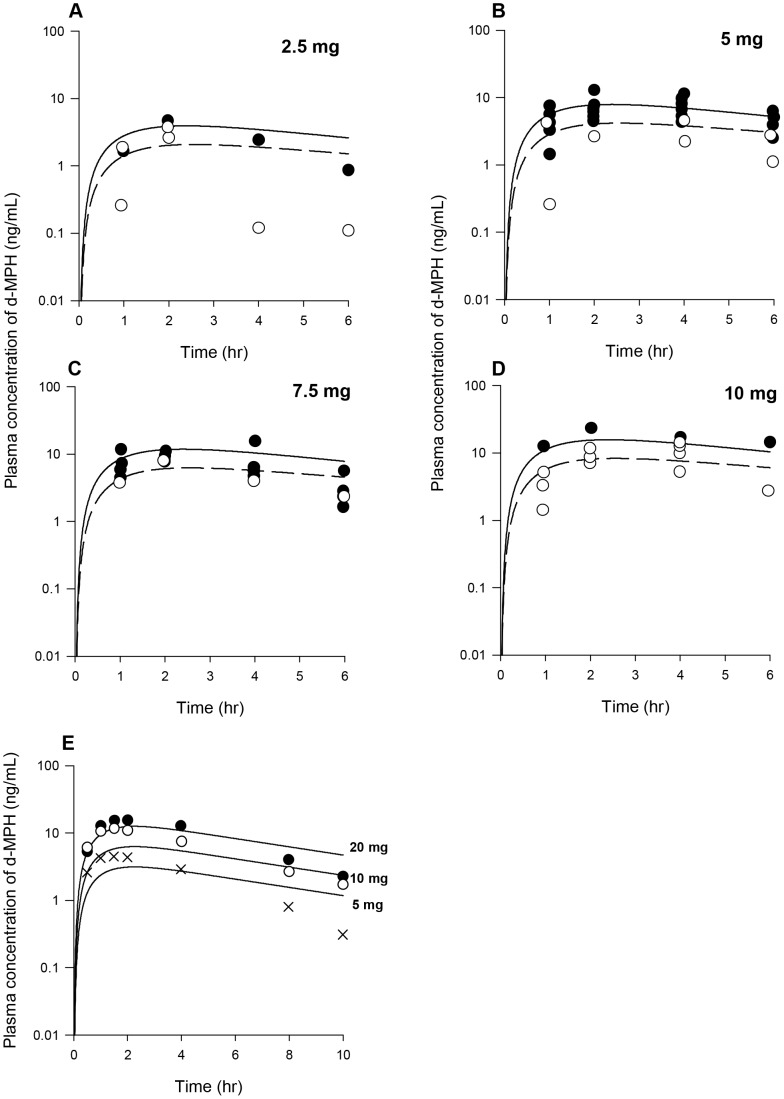
Figure 12. Plasma concentrations obtained after oral dosing of children with MPH.
Panel A: Data represent model simulated (lines) and observed (circles) plasma concentrations of d-MPH after oral dosing with 2.5 mg MPH in preschool-aged (•) (n = 1) and school-aged (○) (n = 2) children with ADHD [49]. Solid line represents simulations for preschool-aged children and dashed line represents simulations for school-aged children; Panel B: Data as described for Panel A obtained after oral dosing with 5 mg MPH in preschool-aged (•) (n = 8) and school-aged (○) (n = 2) children [49]; Panel C: Data as described for Panel A obtained after oral dosing with 7.5 mg MPH in preschool-aged (•) (n = 4) and school-aged (○) (n = 1) children [49]; Panel D: Data as described for Panel A obtained after oral dosing with 10 mg MPH in preschool-aged (•) (n = 1) and school-aged (○) (n = 4) children [49]; Panel E: Data represent model simulated (lines) and observed plasma concentration of d-MPH after oral dosing with 5 mg (×), 10 mg (○), and 20 mg (•) MPH in boys with ADHD (n = 31) [50].

