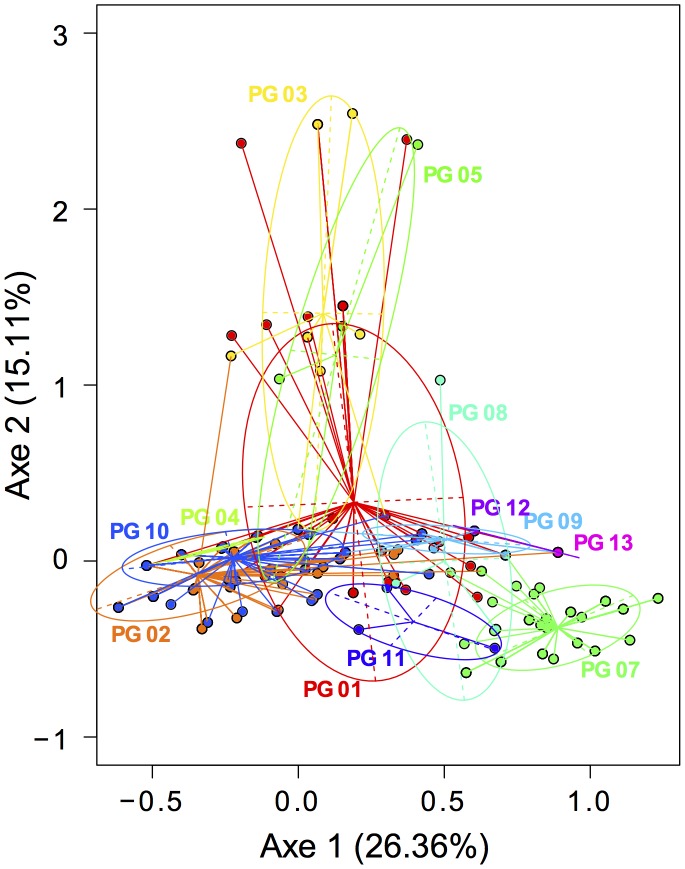
Figure 4. Phenotypic patterns associated with each of the 13 phylogroups of P. syringae revealed by a Multiple Correspondence Analysis (MCA).
The analysis was based on 763 isolates and 11 phenotypes (see Table 2). Each color and each ellipse symbolize one phylogroup. A Monte-Carlo test (999 replicates) on a linear discriminant analysis confirmed that phenotypic dissimilarities were higher between phylogroups than within groups (P<0.001).

