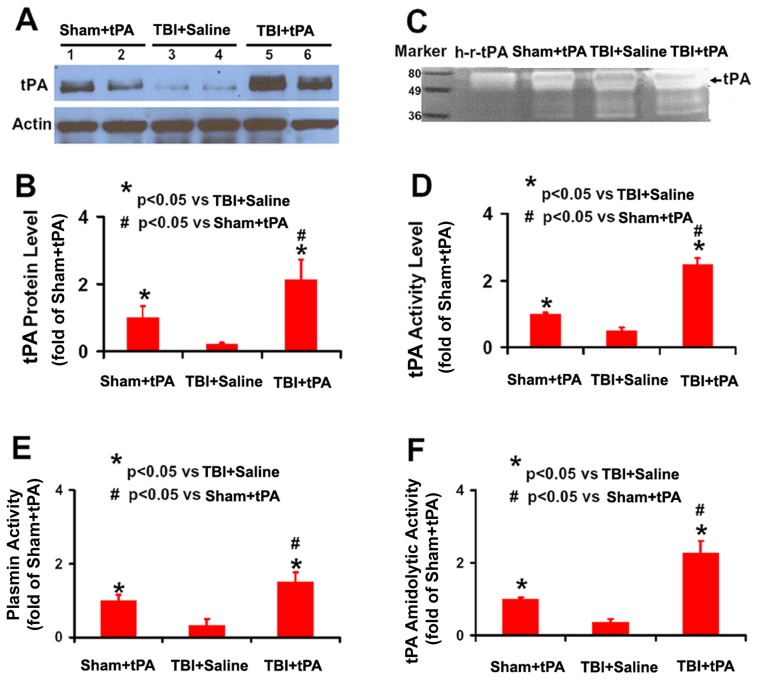
Figure 1. tPA protein level and activity as well as plasmin activity in rat brain.
Western blot analysis of tPA protein levels in the rat brain 24 hr after intranasal administration of tPA (A). Bar graph (B) shows the tPA protein level. Of note, Sham+tPA rats received the same amount of intranasal tPA administration as TBI+tPA rats did. Representative zymographic assay (C) shows an increase in tPA activity in the Sham+tPA rats and TBI+tPA rats compared to TBI+Saline rats. h-r-tPA: human recombinant tPA (15 ng, Genentech). Bar graph (D) shows the tPA activity. Bar graph (E) shows amidolytic activity of plasmin assayed with D-Val-Leu-Lys-p-Nitroanilide Dihydrochloride (S-2251) as its specific substrate. Bar graph (F) shows tPA amidolytic activity with S-2251 as the substrate in the presence of added plasminogen compared to Sham. *p<0.05 vs TBI+Saline. # p<0.05 vs Sham+tPA. Data represent mean ± SD. n = 4 (rats/group, in graphs D, E, and F).

