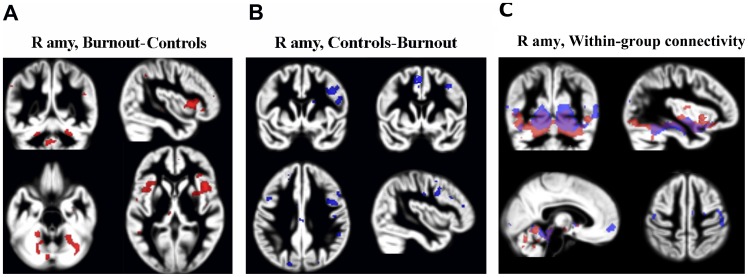
Figure 4. Group difference in resting state functional connectivity from the right amygdala (R amy).
Red clusters were calculated from the burnout group - control-group contrast (A), and blue clusters from the reverse contrast (B), (p<0.05 FWE corrected). Clusters are superimposed on the grey matter template (in the MNI space) from the entire study group. (C) Within group connectivity (positive) from the right amygdala. Blue clusters show connectivity clusters in controls, red clusters in the burnout group.

