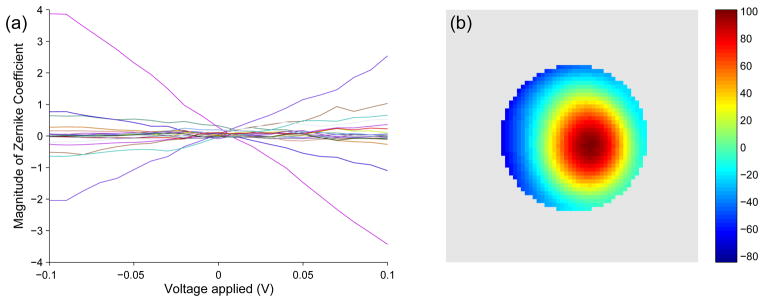
Fig. 5.

Actuator 22 calibration using a Zernike parametrization. (a) Each of the 20 Zernike coefficients varies nearly linearly with voltage. The slope of the relationship is plotted as a phase plot in (b). (b) The “single-hump” peak of the phase plot depicts the movement of the actuator at the location of the peak (colorbar units = radians/V).
